Your Answer ▼
|
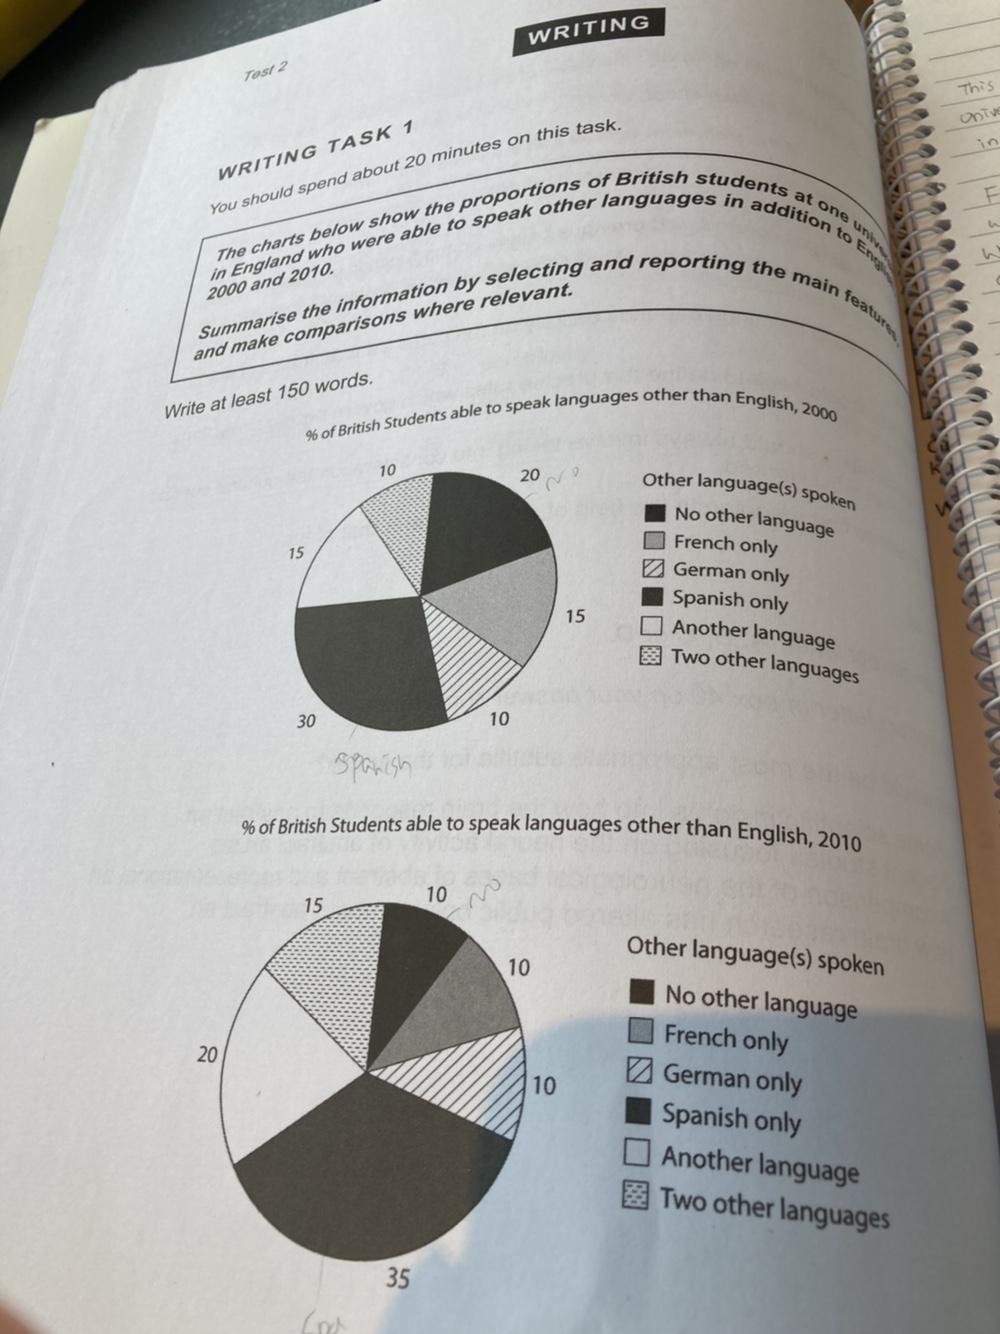
| This chart below show the proportions of British students at one oniversity in England who were able to speak other languages in addition to English in 2000 and 2010.
|
| First of all , on first Chart , the most noticeable part is Spanish which took more than quater, It which was 30%. Secondly biggist proportion was no other languages with 20%. The following was French as well as another language, for instance, Italian or Chinese. They recorded exactly same percentage 15 %. Likewise, German and Two other languages were same with 10 % each. |
| On the other hand, on second graph, the most remarkable change within 10 years, was the rates of student who can't speak showed any other language,except for their mother tongue, showed 10% less percent. However other language and two other languages, gained 5 percent. Meanwhile, German was same as 10 years ago. Finally, proportion of French speakers was 10%. |
| In conclusion, chart resealt result says , new generations speak more diverse languages. Compare to 10 years back. |


 인쇄
인쇄


 비밀번호 확인
 댓글 0개
댓글 0개


 불편사항 신고