


 인쇄
인쇄


The bar chart shows expectation to change of European young people in the next 20 years in 5 different areas.
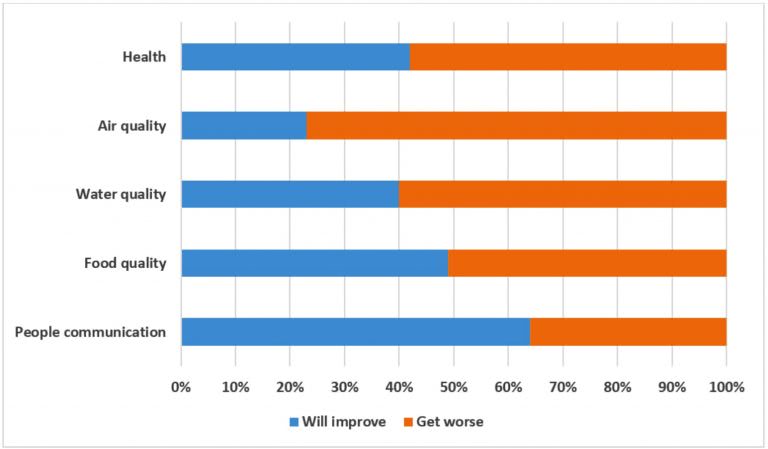
The given bar chart provides information
about the anticipation of young people in Europe for the change of 5 categories each category
in the next 20 years.
Overall, more young people expect that all areas will be worse over the next 20 years except for communication between people young people expect that all areas
will be worse over the 20years except people communication. (기존 문장은 의미가 완전히 다르고, 이는 점수에 꽤 큰 타격을 줍니다. 혹시 왜 이렇게 바꿔드렸는지 모르시겠다면 댓글 주세요!)
Looking at the graph in detail, about 77%
of respondents expect that the air pollution will be worse which is over three
times more than the number of people who believe it will be improved. Similarly, more
than half of surveyed people answer that the water quality will be declined in
the future. While the number of people who expect a drop in health is just over
40%, that for food quality is just under 50%.
However, more than 60% of surveyed people answer
that the people communication will be improved in the future and this is the
only area that people have a positive expectation. Meanwhile, the number rate of people
who have negative thoughts in water quality and health is similar with 60% and around
58% respectively.
총평: (6/6/7/7) 6.5
두 번째 문단만 아니었어도 7점도 노려볼법 해서 아쉽네요. 해당 부분은 중요한 사항이므로 꼭 수정해주셔야 합니다. 수고하셨습니다 :)

 비밀번호 확인
 댓글 0개
댓글 0개


 불편사항 신고