


 인쇄
인쇄


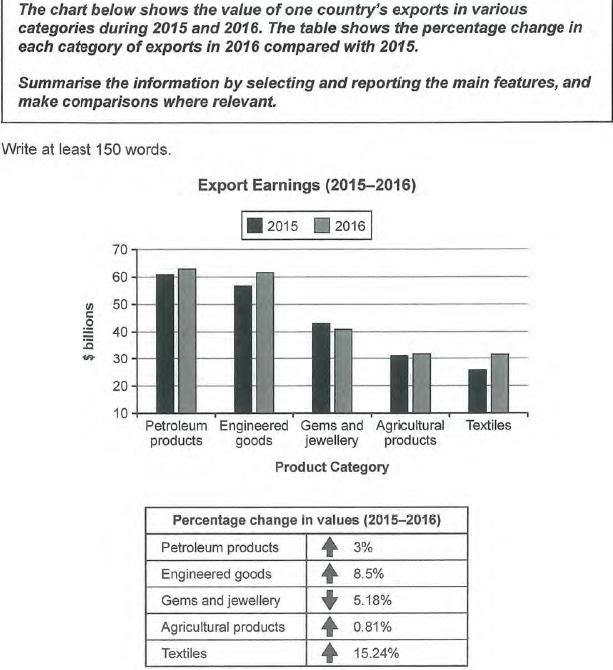
These charts show how much one country export in various categories and how to change the percentage in each categories during 2015 and 2016.
Overall, it is clear that the value of petroleum products was the highest export, while the value of textiles was the lowest exports in a country. However, all of the value of exports increased for a year without gems and jewellery.
Looking at the charts more closely, one can see that the value of textiles increased dramatically from 25 billion to 32 billion. It was the most growth between 2015 and 2016. The value of engineered goods increased from 55 billion in 2015 to 61 billion in 2016. It rose 8.5 percentage point for a year. The value of petroleum products and agricultural products made up 62 billion and 31 billion, respectively. Those things rose 3 percentage point in petroleum products and 0.81 percentage point in agricultural products during 2015 and 2016. However, only the value of gems and jewellery was down trend. It decreased from 43 billion in 2015 to 41 billion in 2016. It dropped 5.18 percentage point between 2015 and 2016.

 댓글 0개
댓글 0개


 불편사항 신고