


 인쇄
인쇄


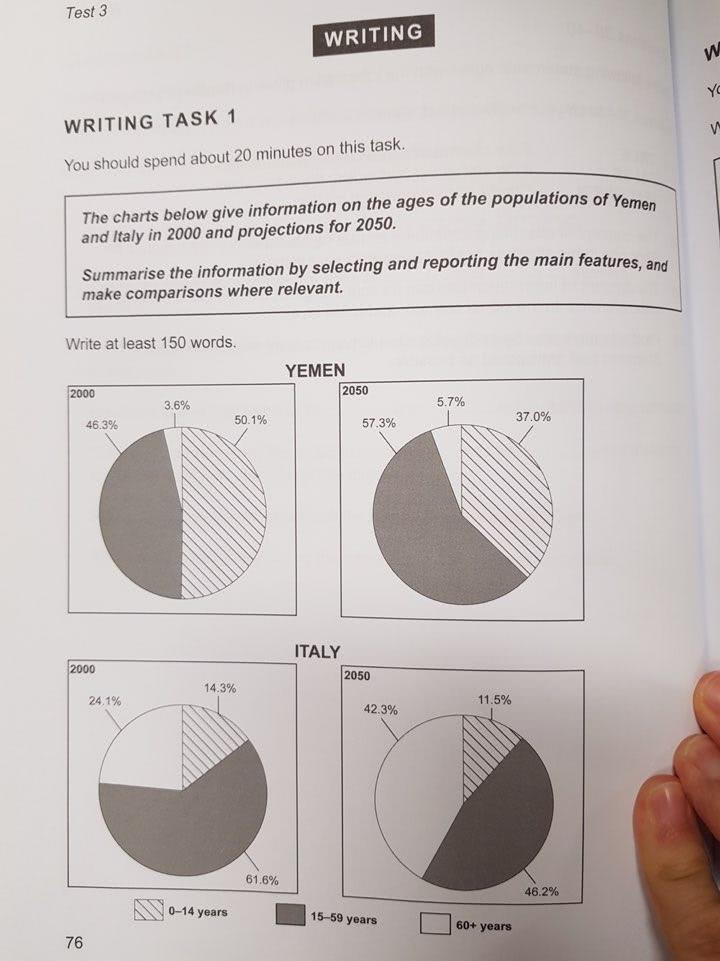
The pie charts show that the populations divided by ages in Yemen and Italiy the year of 2000 and the future result of 2050. (엔터를 한 번만 치는 경우는 이유불문 없습니다. 아예 치지 않던가, 두 번 치는 쪽으로 해주세요~)
Overall, it is clearly seen that the population of young generation in Yeman increased while old generation increased in Italiy. (과거의 사항이 아니라 미래의 예측치입니다.)
According to the chart, it is the most significant change in Yeman is that that the rate of people who aged 15-59 years old increased from 46.3 % to 57.3% during the period while young people who under 14 years old deceased for about 50 years from 50.1% to 37%. In contrast, there will be no big change for people who aged over 60 years old.
It is notable that the share of number (number 라고 하면 틀립니다! 이 표에서 수는 알 수 없어요.) of old people in Italy expected to increased in 2050 unlike Yeman. The percentage of population for old generation who aged over 60 years in Italy were only 24.1% in 2000, however, it will be 42.3% as progections for 2050. (여기도 엔터치지 않습니다.)
At the same time, the number of (여기도 마찬가지이고요.) young people aged 15-59 years dramatically decreased from 61.6 % to 46.2% over the recerch period. The chart for Italy also prospects that children who aged under 14 years has only slight chages from 2010 to 2050.
총평: (5/5/5/5) 5.0
전 수험생이 공통으로 task 1을 2에 비해 못 쓰지만, rainv님께서는 유독 그 격차가 큰 편에 속합니다. 어차피 최소 필요 점수가 6.0이라고 하셨으니, Task 2만으로도 웬만하면 받으시겠다만, (대신 task 1이 이정도면 총점도 5점대일 겁니다.) 그래도 안전하게 넘기기 위해 task 1도 어느정도 신경써주세요. 엔터키의 사용도 점수에 들어가니까 주의해주시고, 철자 오류가 지금처럼 많을 경우 곤란합니다.
마지막으로, 수와 비율은 반드시 구분해주시고, 이 글에 한해서는 미래 시제 쪽으로 작성해주세요~수고하셨습니다 :)

 비밀번호 확인
 댓글 0개
댓글 0개


 불편사항 신고