


 인쇄
인쇄


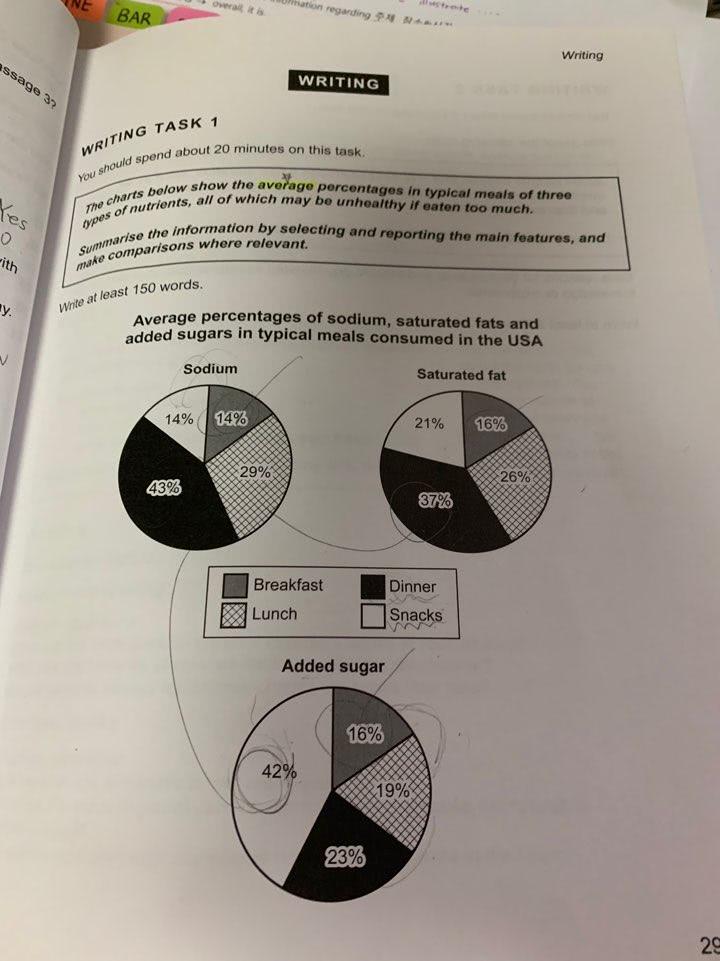
The pie charts represent how much the sodium, saturated fat and added sugar were consumed in the average meals in the United states.
(엔터 한 번 더 쳐주시면 됩니다.)
Looking at an overall perspective, the majority of sodium and saturated fat were consumed at dinner (여기는 정말 주의해주셔야 합니다. 두 영양소가 저녁에 가장 많이 섭취되는 것은 맞지만, majority 는 전혀 다른 얘기입니다. 아무리 못해도 75% 정도는 되어야 해당 표현을 사용할 수 있으므로 주의해주세요~) while most sugary meal was taken from snacks Snacks. By by contrast, all three types of nutrients were ingested the least at breakfast.
It is noteworthy that the highest consumption of sodium is seen at dinner accounting for 43%, followed by saturated fat of 37%. Likewise, lunch was inclined to be salty and fatty in comparison with breakfast and snacks, accounted for almost 30% of each nutrient. The rate (양 자체는 알 수 없습니다. 비율만 알 수 있고요.) amount of added sugar in average lunch and dinner were relatively low at 19% and 23% respectively.
According to the snacks and breakfast, Interestingly interestingly, they were both made up of 14% sodium. Snacks snacks stood out as the most consumption of sugar with 42% while the sodium and saturated fat were comprised of less than a quarter. Only only between 14% and 16% of each three kinds of nutrients were consumed at breakfast, making the lowest rate among other types of meals.
총평: (6/6/7/6) 6.5
예전에 적어주신 지도 문제에 비해 조금 아쉬웠네요. 일단 대소문자 구분이 간혹 안 되고 있는 모습이 보이므로 수정해주셔야 합니다. 또한 현재 표에 대한 이해가 정확하게 되지는 않은 상태인데, 여기에 대해 간단히 말씀드릴게요. 지금 표의 수치가 의미하는 바는 다음과 같습니다. 일일 전체 섭취한 설탕을 100%로 놨을 때, 이 중 저녁에 섭취한 설탕의 비중이 23%입니다. 그러나 마지막 문단의 첫 문장은, 아침에 섭취하는 전체 영양소 중 나트륨이 14%를 차지한다~와 같이 화살표관계가 뒤바뀐 표현을 하고 있으므로, 이와 관련해서 고쳐주세요~수고하셨습니다 :)

 비밀번호 확인
 댓글 0개
댓글 0개


 불편사항 신고