


 인쇄
인쇄


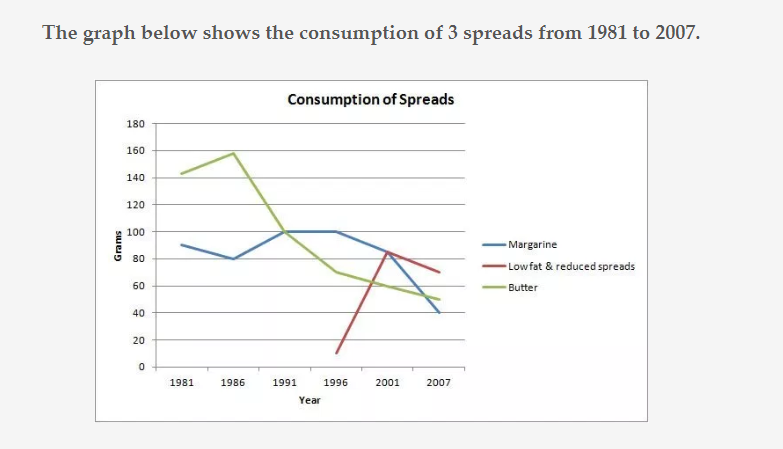
The line graph represents the changes in
consumptions categorizing three types of spreads between 1981 and 2007.
Overall, the respective spreads have a different tendency for each. People consumed butter less and less, on the other
hand, the amounts of low fat and reduced spreads soared after 1996. Lastly, the
consumptions of margarine didn’t have dramatic changes even if it had slightly
fluctuated during the period shown in the graph.
To be more specific, while butter
consumptions decreased down to 70 grams until 1996 after peaking top at
approximately 160 grams in 1986, (이 이후 low fat 은 현재의 문장과 하나의 문장으로 묶기가 조금 어렵습니다. 그냥 독립시켜주세요~) low fat and reduced spreads emerged suddenly
in 1996. It shows that company understood and analyzed the fact that people
during the 90’s became to have a tendency to eat much healthier spreads. (이런 식의 주관적인 해석을 기미하는 것은 되게 위험합니다. 모든 조건이 잘 맞아떨어져서 운좋게 좋은 평가를 받을 수도 있겠지만, 그렇지 않을 경우가 대부분이라...웬만하면 수치 내에서만 머무르는 걸 추천드려요. 물론 제가 이걸 따로 강요할 수는 없지만, 강하게 권장드리긴 합니다.) People have a strong
tendency to have spreads with healthier ingredients around 80 grams in 2001.
After that, in 2001, people consumed the
all spreads less and less. All three types of spreads didn’t have any upwards trends in consumption, ranging from 2001 to 2007. Significantly, the consumption on margarine dramatically
diminished from 80 grams to 40 grams while that of the two other spreads had subtle declines.
총평: (6/7/7/7) 7.0
실전에서도 문법이 이정도는 되어야 합니다. 지금 문장들에 간혹 오류나 어색한 표현이 있긴 했어도 대체로 봤을 때 정확도는 높았으며 다양한 문장들이 쓰였네요. 세 번째 문단의 경우, 표시해드린 부분 자체에 국한되는 것은 아니고, 유형 관계없이 일반적인 task 1에서 저런 해석을 하는 것은 정말 위험하니까 주의해주셔야 합니다. 특히 회사를 끌고 오는 것은...자의적인 해석이 될 가능성이 높습니다. 수고하셨습니다 :)
18분/184/

 비밀번호 확인
 댓글 0개
댓글 0개


 불편사항 신고