


 인쇄
인쇄


안녕하세요! 목표점수는 6.0 이고 시험은 이번주 토요일입니다! 감사합니다!
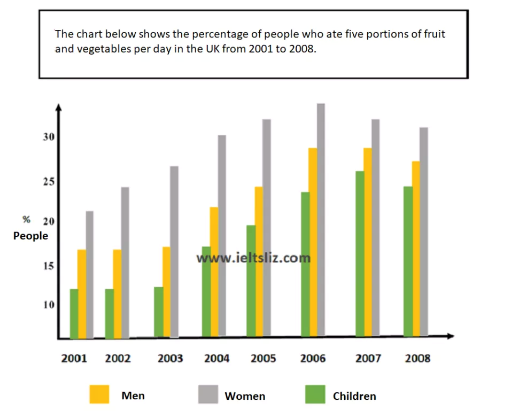
Overall, it is clear that women was a type that had by far the greatest percentage over the entire research period.
However, the proportion of female showed an upward trend until the year 2006, peaking at about 35 per cent while the figures of men and children increased until 2007 which is just next year of 2006. (여기는 흐름이 되게 이상해서, 댓글 한번 주세요!) After 2006, Women’s consumed percentage declined constantly by 2008.
In terms of children, they displayed the smallest amount of fruit and vegetables which are consumed all the year in this chart. ('비율' 이 가장 낮았다고 적어주셔야 합니다.) Although the gap between male and children was almost doubled at the beginning of the period, it became closer as about 2 per cent (퍼센트포인트로 적어주시면 되는데, 그걸 떠나서 2%포인트보다는 조금 더 크지 않나 싶네요.) in 2007. They underwent rises between the beginning and 2007 and drops the same by the end of the research span.
총평: (6/5/7/6) 6.0
마찬가지로 조금씩의 오류가 보이긴 하나, 6.0선에서는 크게 문제가 없을 겁니다. 표시해드린 부분만 한번 댓글 주세요! 수고하셨습니다 :)

 비밀번호 확인
 댓글 2개
댓글 2개


 불편사항 신고