


 인쇄
인쇄


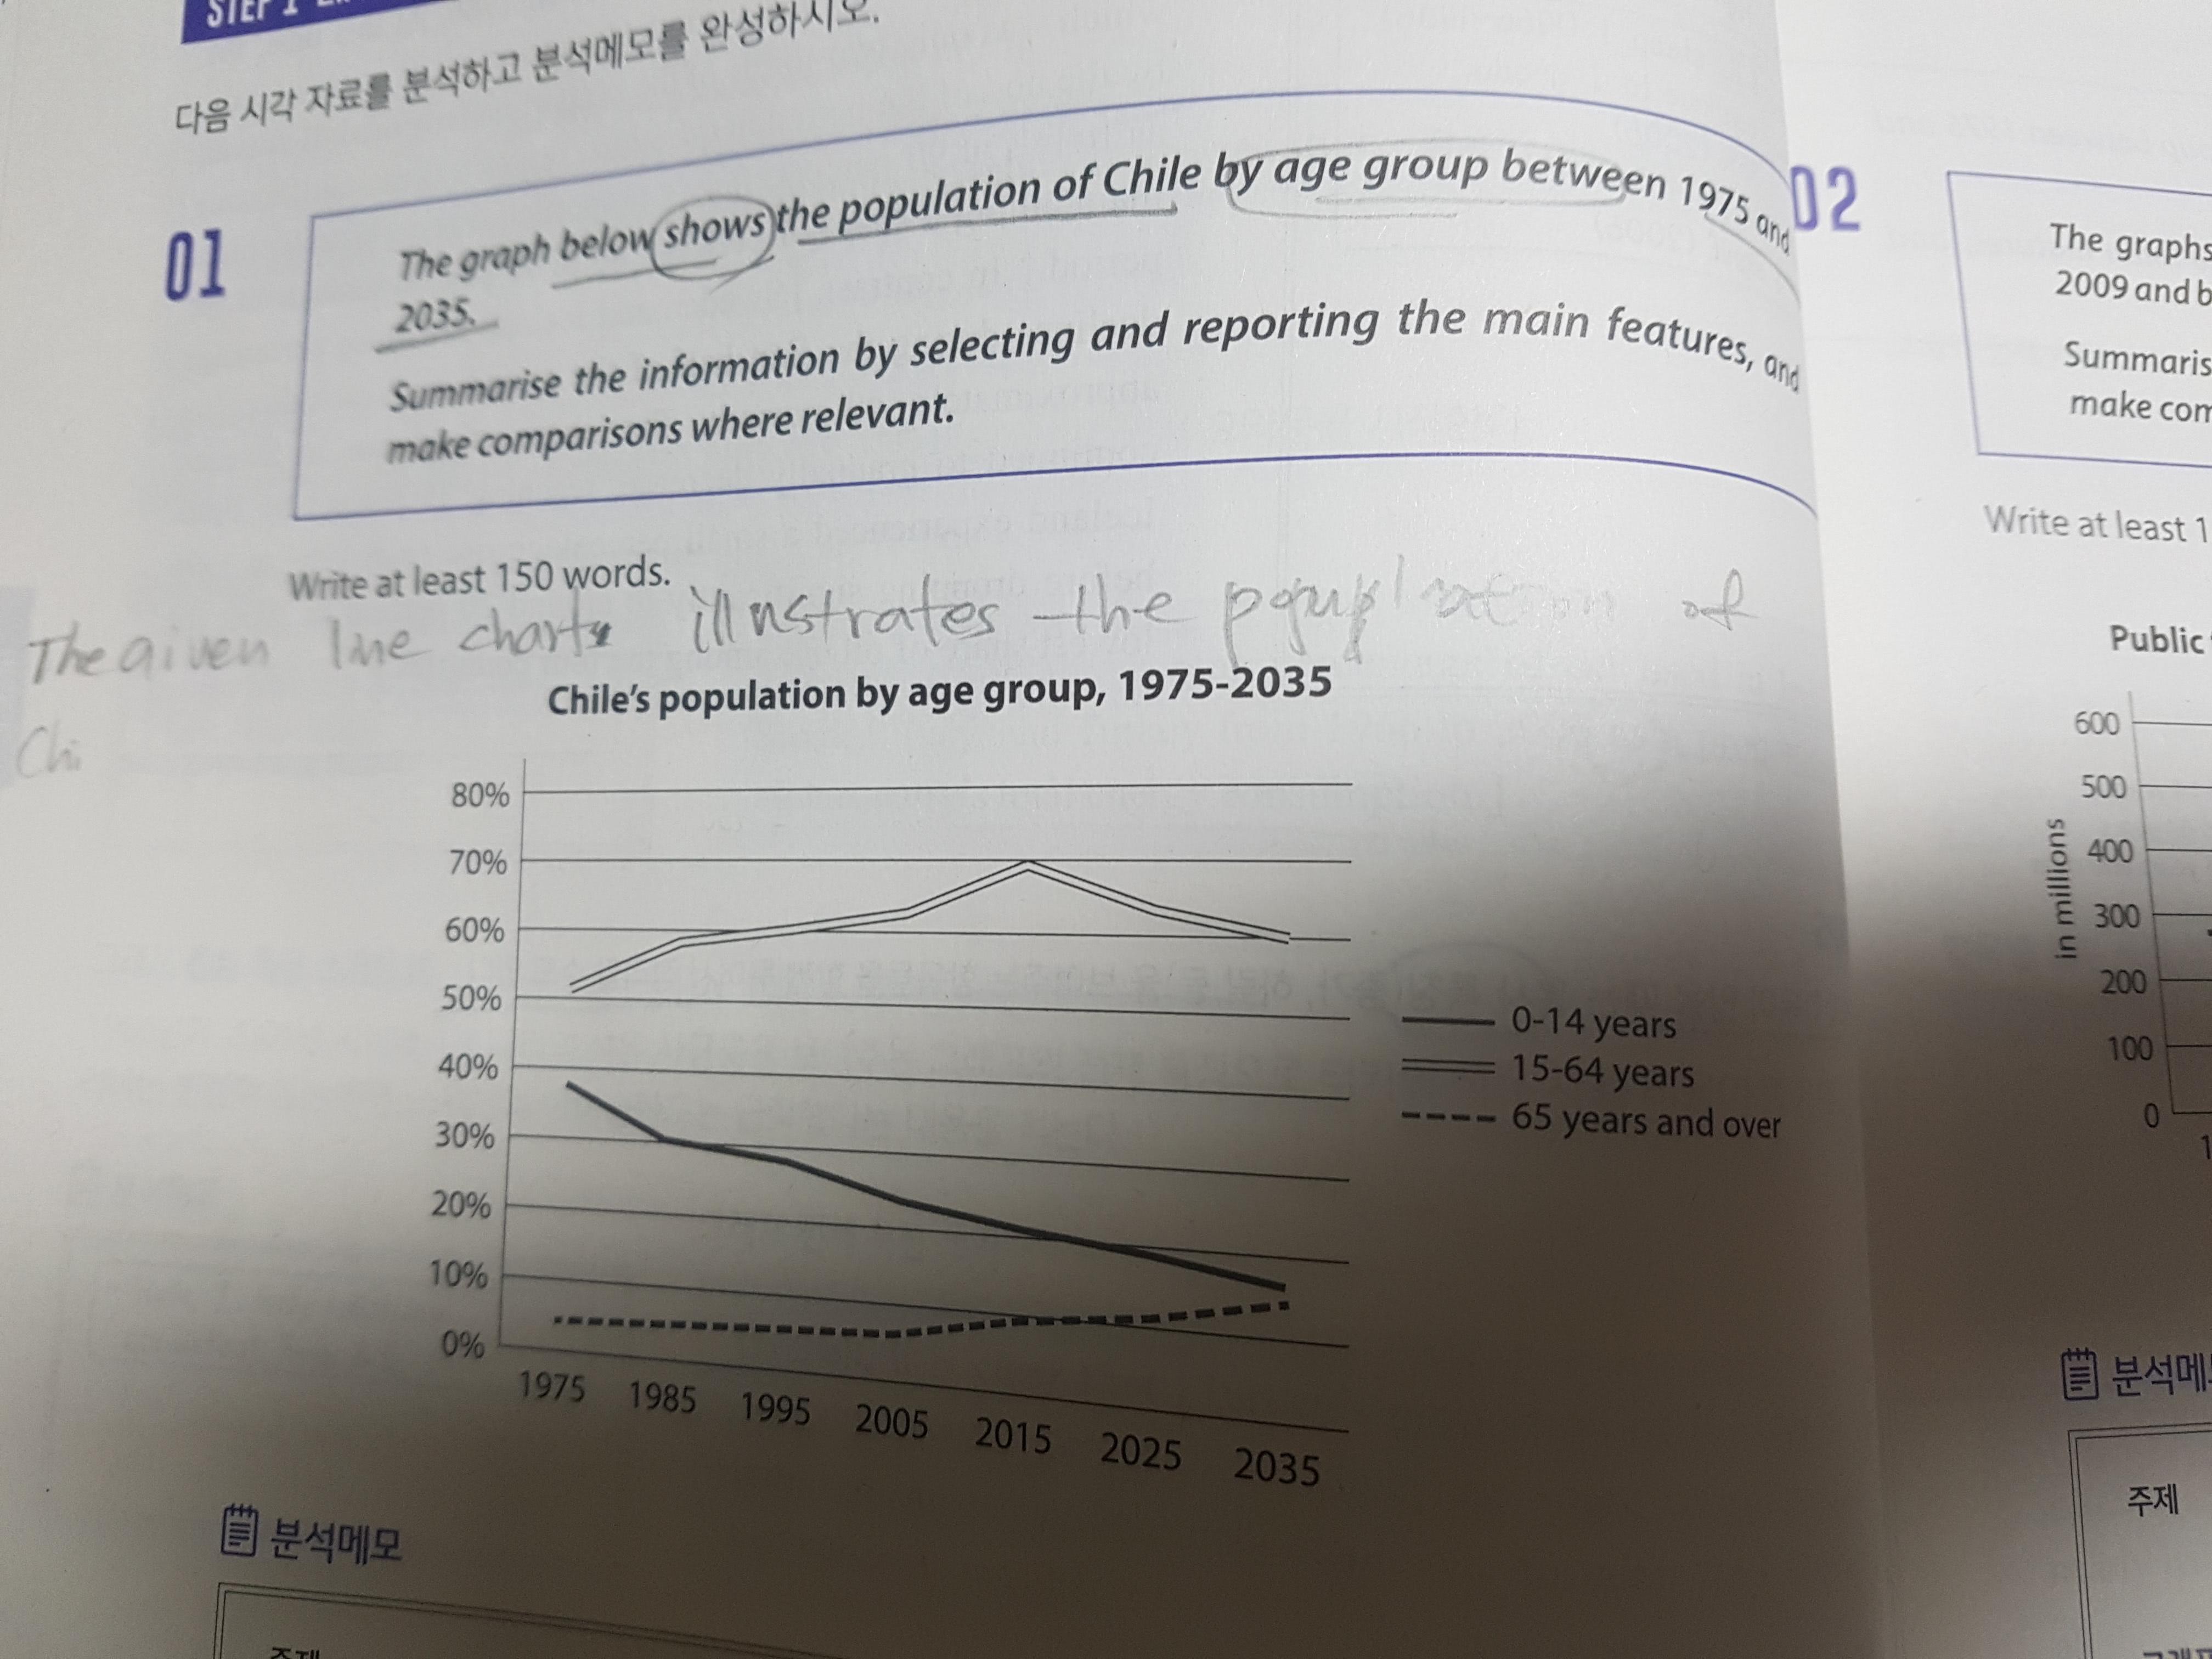
The given line graph illustrates the population of Chile by the age group of 15-64 years, the group of over 65 years and the group of under 14 years from 1975 to 2035.
Overall, the portion of people between 15 years old to 64 years old was occupied the most part of the all population, which increasing gradually to 2025, roughly 70%, before decreasing to 60% in 2035. On the other hand, the portion of people under 14 years old was diminished gradually and is expected to decrease constantly. While the portion of the age group over 65 years was lowest during the period in question, the percentage of the group of over 65 years was increasing and will keep going on that trend until 2035.
Looking at the graph more closely, one can see that people between 15 to 64 years was a half of population in 1975, which was nearly 10 times compared to people over 65 years. the proportion of between 15 to 64 years was increasing to 70%, which was a peak of the percentage in 2015, ans will drop to 60% in 2035. Although the portion of people under 14 years was nearly 40% in 1975, it will be roughly halved in 2035. While the people over 65 years was less than 5% in 1975, it was increased constantly, which will be as similar as the portion of under 14 years at the end in the given period.

 댓글 0개
댓글 0개


 불편사항 신고