


 인쇄
인쇄


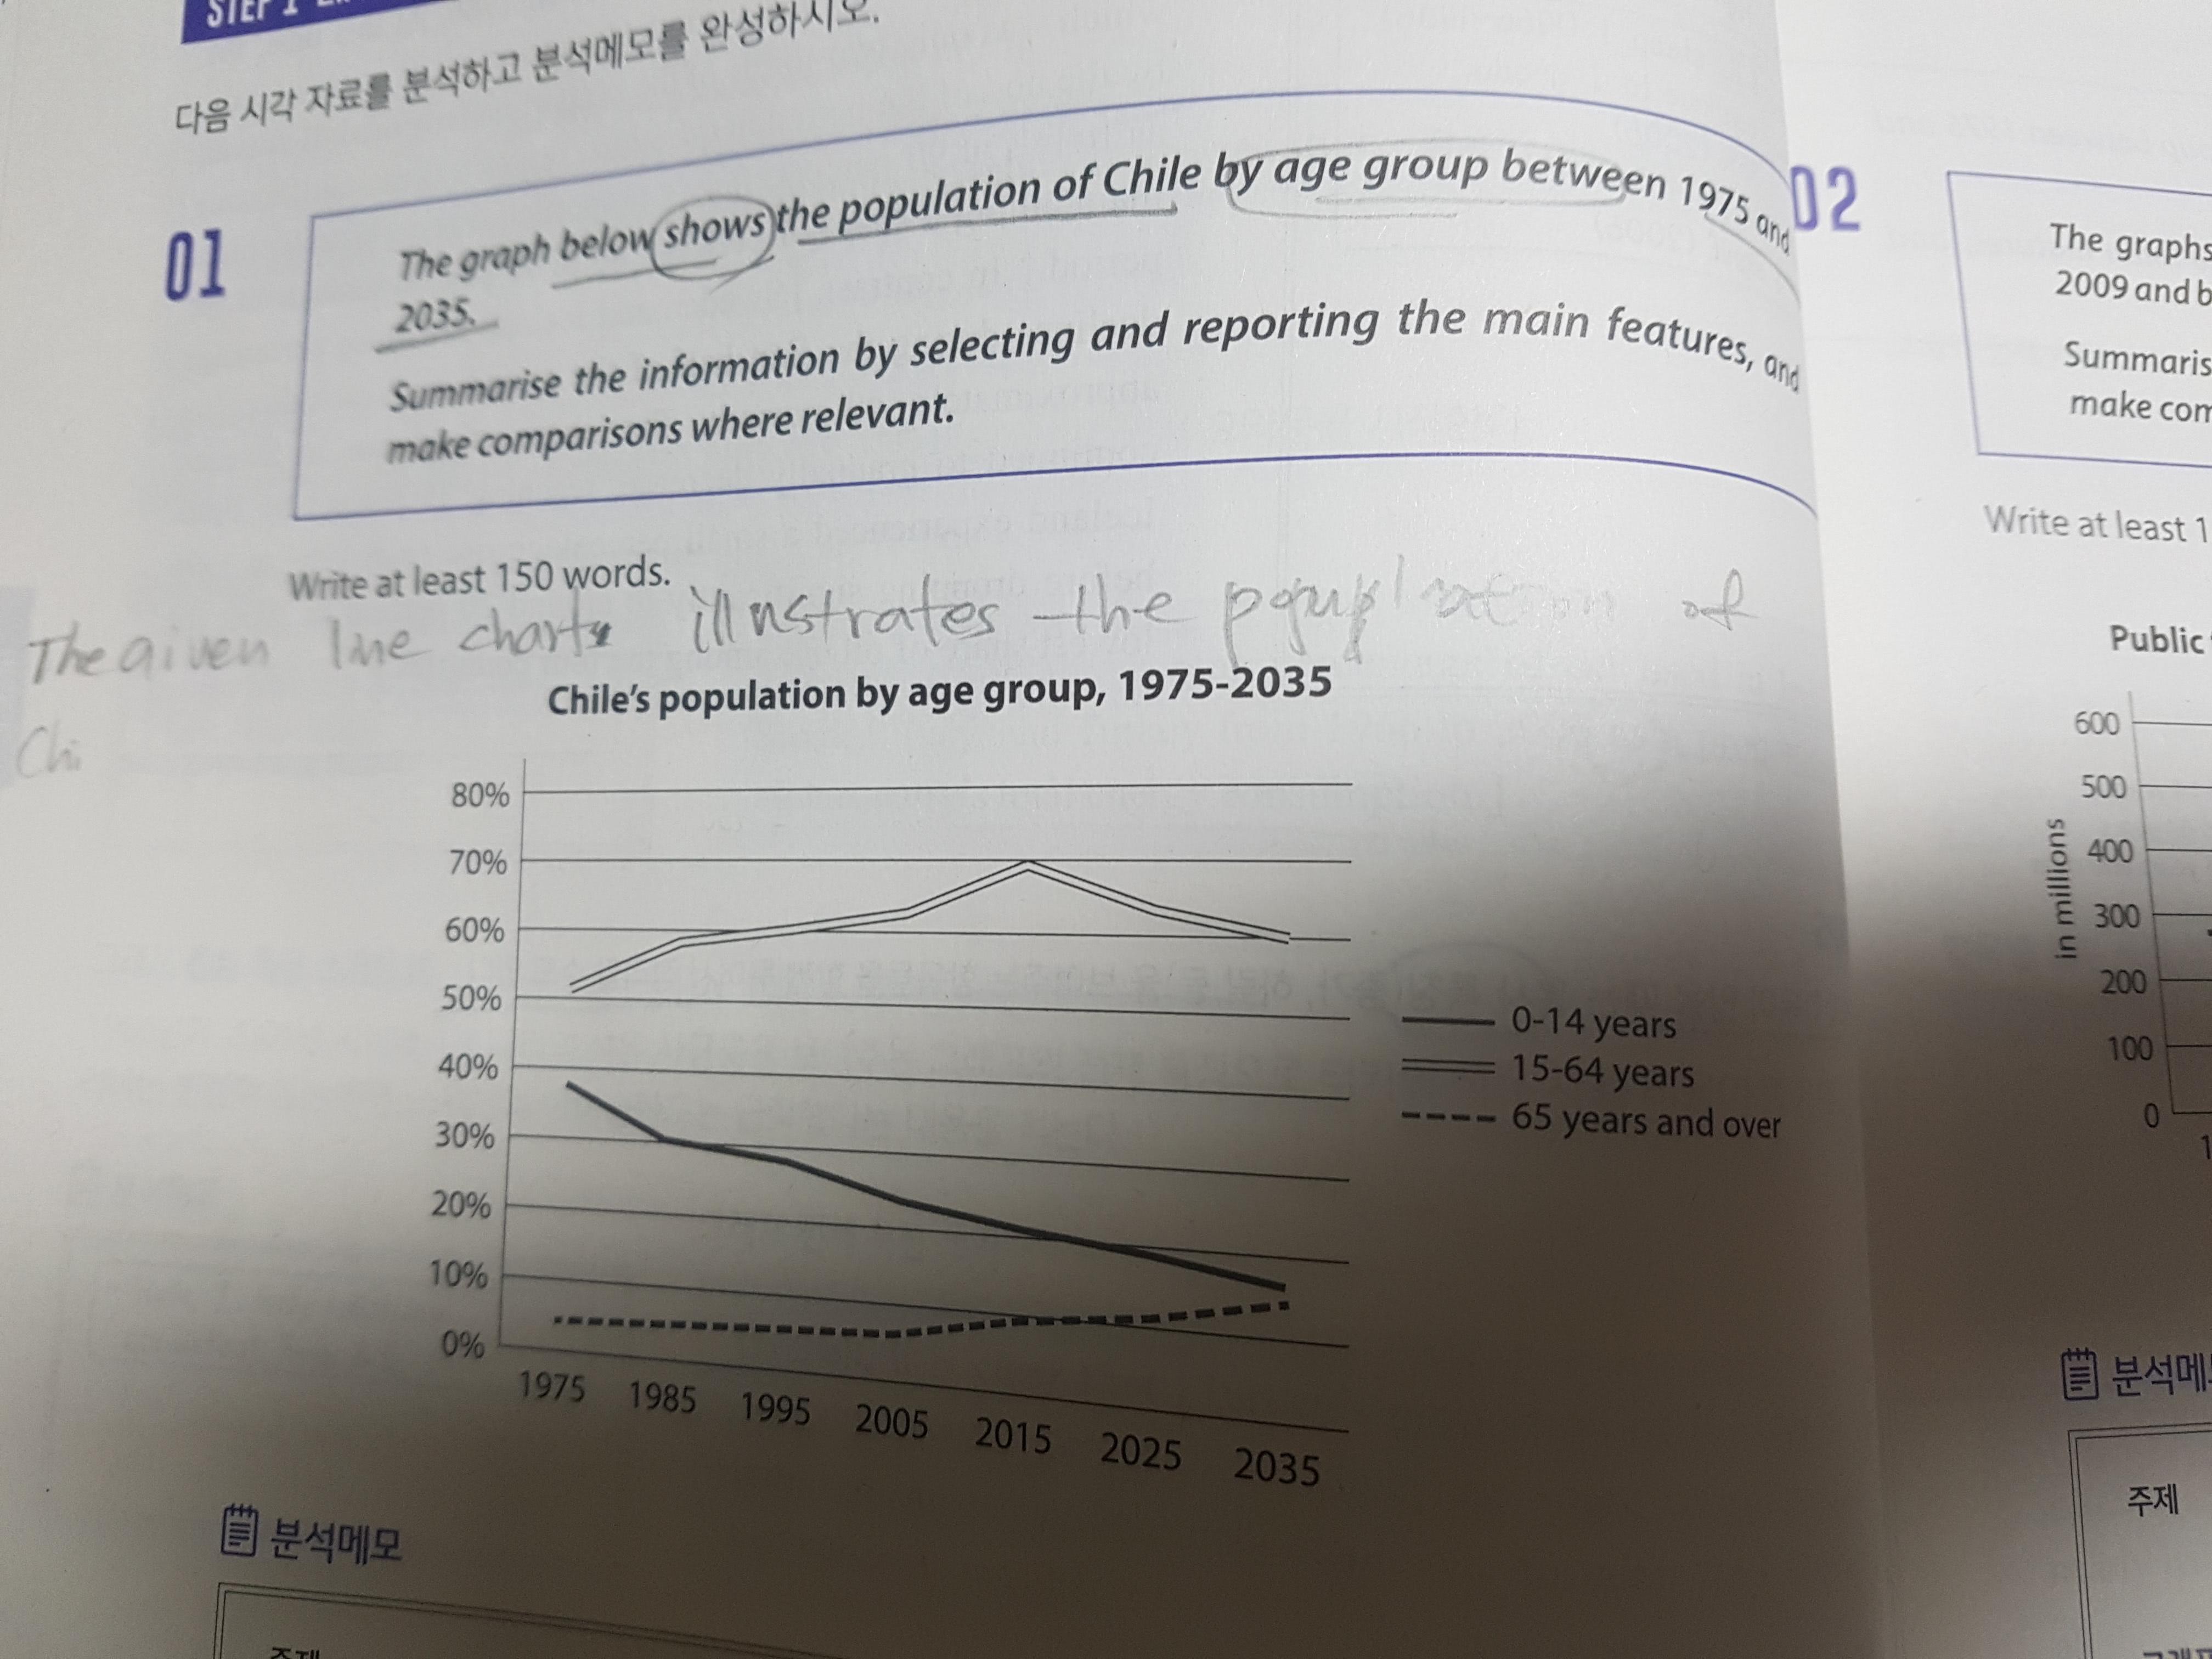
The given line graph illustrates the population of Chile by the age group of 15-64 years, the group of over 65 years and the group of under 14 years (이런 거 나열하지 않습니다.) from 1975 to 2035.
Overall, the portion of people between 15 years old to 64 years old was occupied the most part of the all total population, which increasing gradually to 2025, roughly 70%, before decreasing to 60% in 2035. (여기의 경우 시제를 미래로 맞춰주셔야 합니다. 바로 밑에 is expected to~~와 비슷한 맥락에서요.) On the other hand, the portion of people under 14 years old was diminished gradually and is expected to decrease constantly. While the portion of the age group over 65 years was lowest during the period in question, the percentage of the group of over 65 years was increasing and will keep going on that trend until 2035.
Looking at the graph more closely, one can see that people between 15 to 64 years was took a half of the population in 1975, which was nearly 10 times compared to people over 65 years. the The proportion of between 15 to 64 years was increasing to 70%, which showed a peak was a peak of the percentage in 2015, ans will drop to 60% in 2035. Although the portion of people under 14 years was nearly 40% in 1975, it will be roughly halved in 2035. While the people over 65 years was less than 5% in 1975, it was increased constantly (증가했고, 증가할 것이다로 나눠적어주셔야 합니다.), which will be as similar as the portion of under 14 years at the end in the given period.
총평: (6/7/6/5) 6.0
Overview의 경우 task1에서 압도적인 비중으로 가장 중요하기 때문에 이 부분에 대해 말씀드리겠습니다. Overview는 짧게, 그러면서도 최대한 포괄적으로 자료를 요약할 수 있어야 합니다. 구체적인 분석은 밑에서 하면 되고요. 그러나 지금의 Overview는 너무 길며, 구체적인 수치까지 들어갔기 때문에 적절하지 않습니다. 수치 역시 밑에서 넣어주시면 돼요.
짧게, 포괄적으로 효과적인 요약을 하는 것은 단번에 되지는 않을 거라 연습이 필요하지만, 구체적인 수치를 넣지 않는 것은 금방 캐치할 수 있으니까 다음부터는 Overview에서 수치는 빼주세요!
수고하셨습니다 :)

 비밀번호 확인
 댓글 0개
댓글 0개


 불편사항 신고