


 인쇄
인쇄


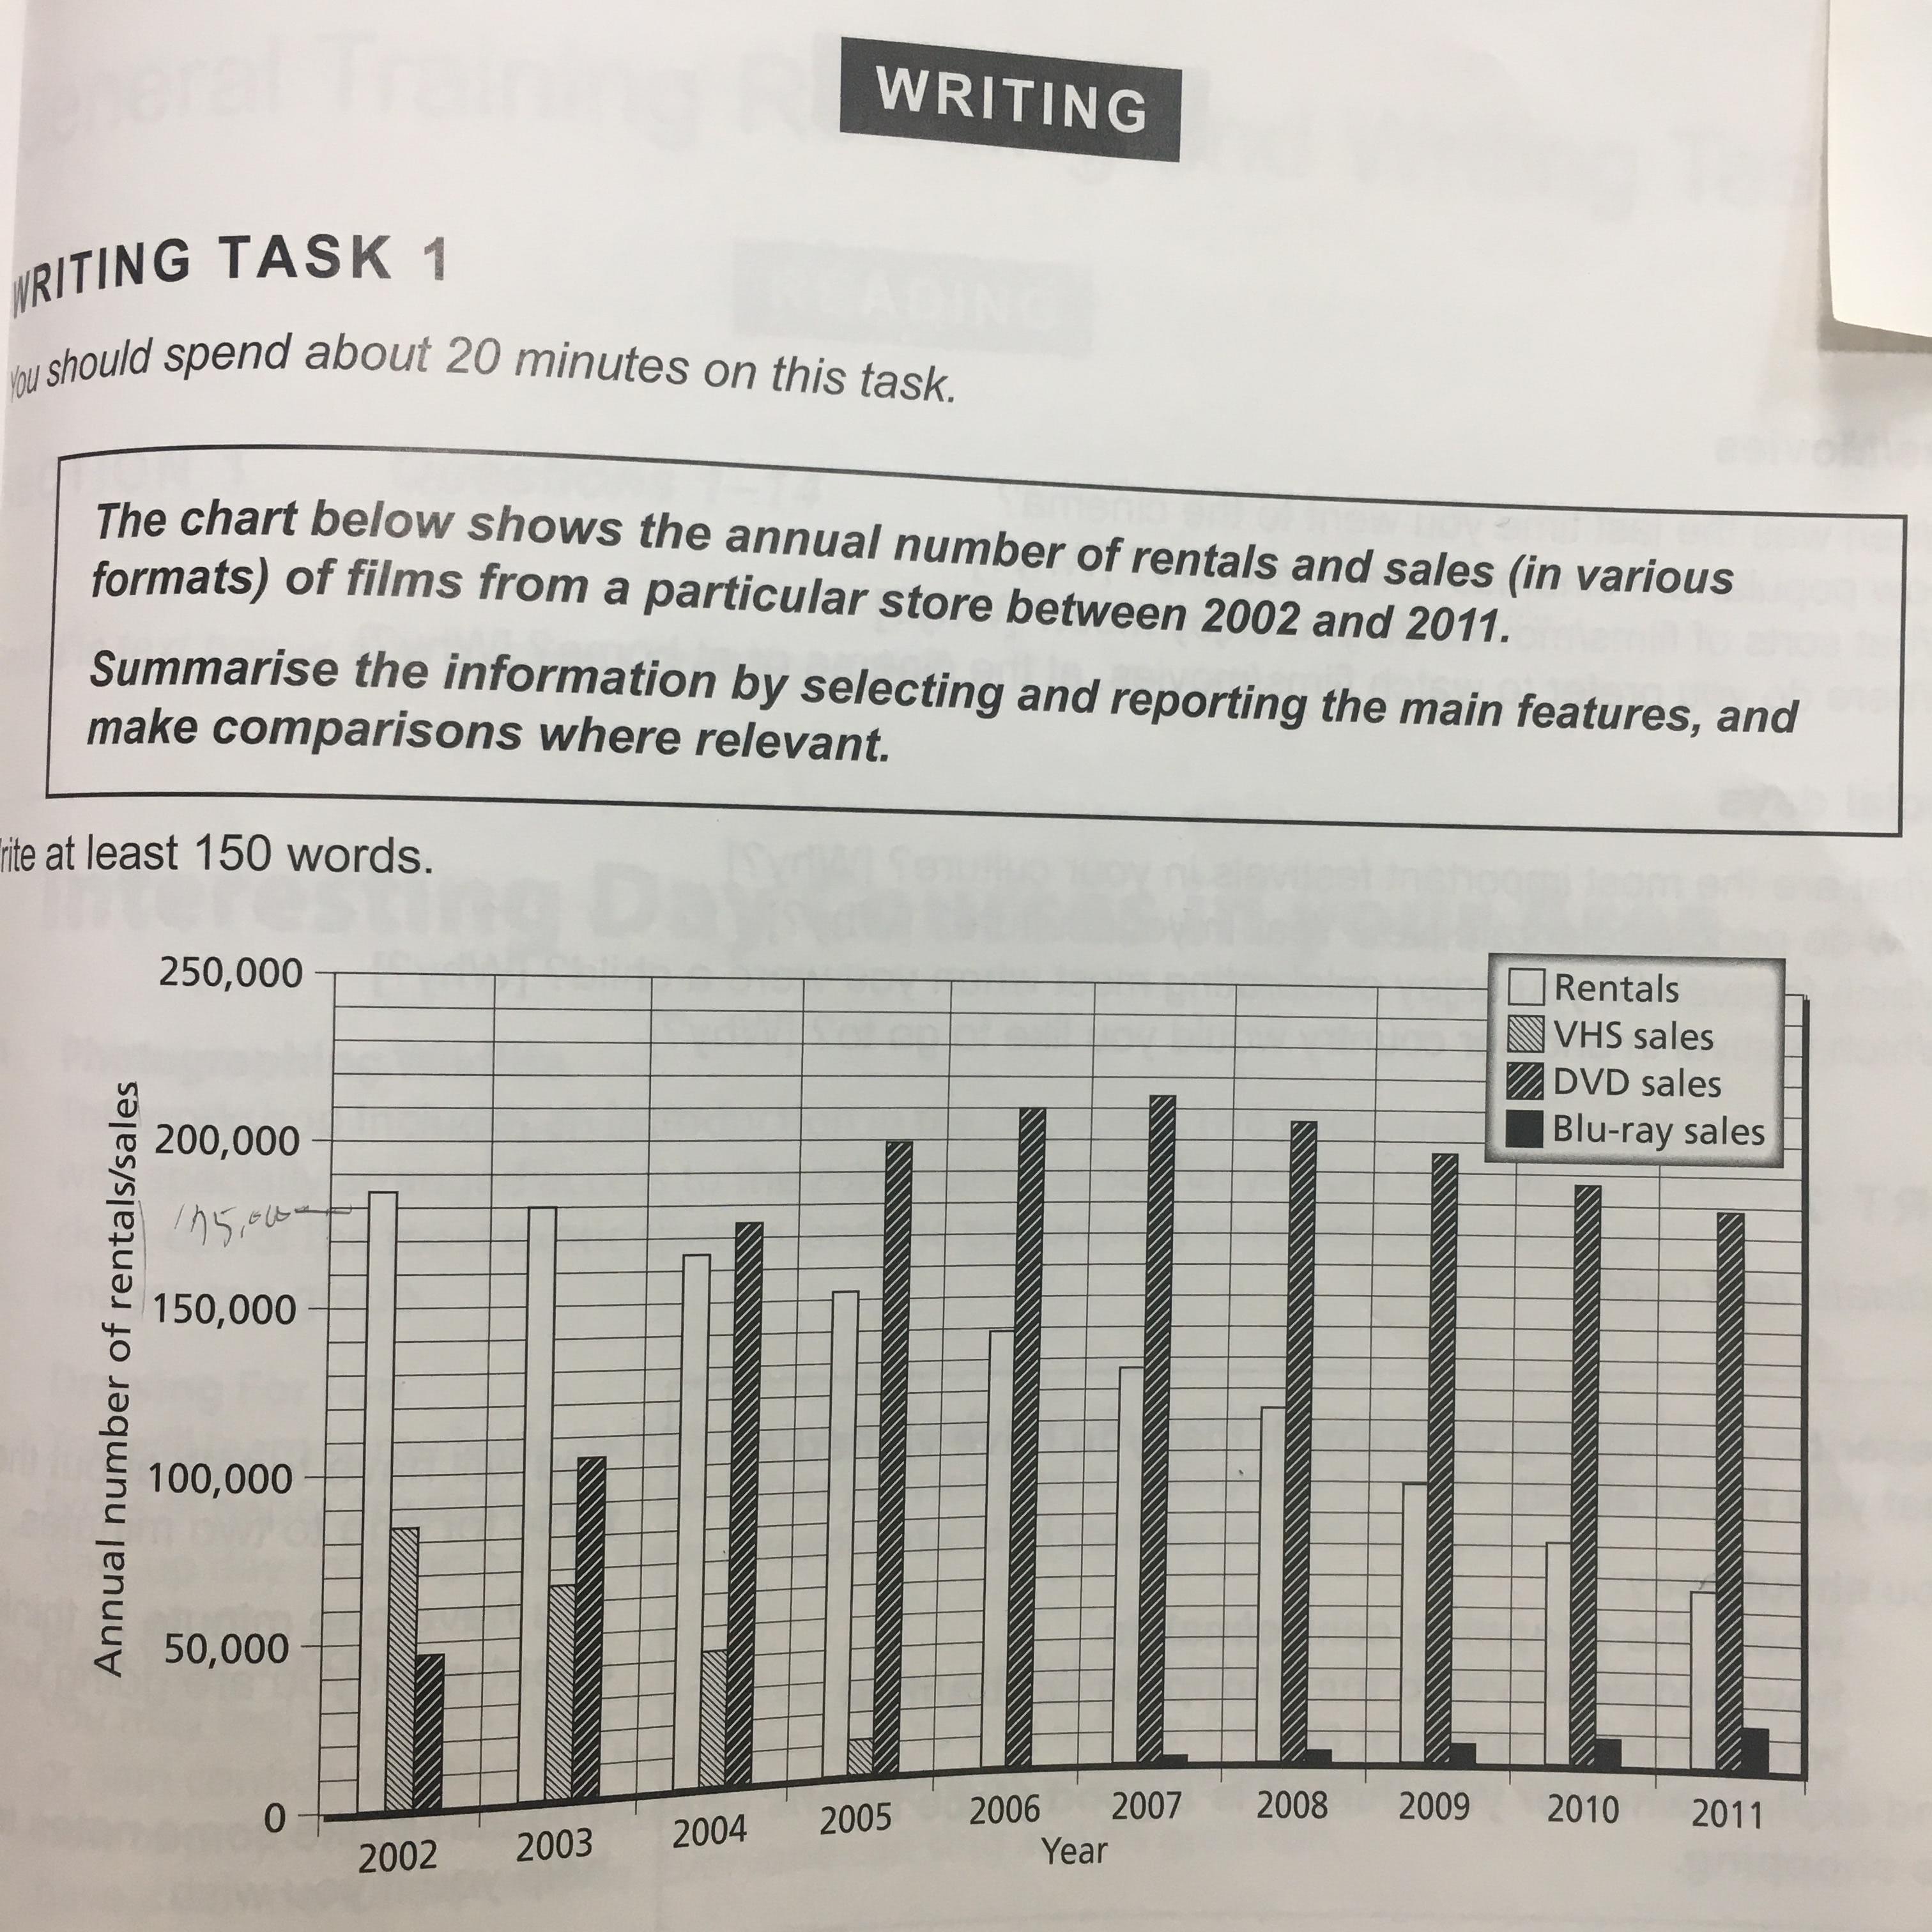
The bar graph indicates the number of film's sales and rentals annually in various formats in a store from 2002 to 2011.
Overall, the number of rentals and VHS sales demonstrated the downward trend, while there are upward trends in the number of DVD and Blu-ray sales. In regarding the number of DVD sales also showed reductions.
Looking at the graph more closely, one can
see that the annual number of rentals has been logged the biggest figure of
sales compared to the others at more than 175,000 in 2002. However, it decreased gradually by the end of the
period to less than 60,000. In case of VHS sales recorded
around 80,000 but, it diminished moderately and finally in 2006, it
disappeared completely. In contrast, we can see the dramatical
rise in the number of DVD
sales, which figures noted
from less than 50,000 peaked at more than 210,000 by 2007. After that, is has dropped slightly by 2011 to approximately
180,000. Finally, Blu-ray was released from 2007. The number of
Blu-ray sales was so poor but it has shown a modest upward
trend, which recorded more than 10,000 in 2011.
첨삭을 토대로 다시한번 작성해서 올립니다. 감사합니다!!

 댓글 0개
댓글 0개


 불편사항 신고