


 인쇄
인쇄


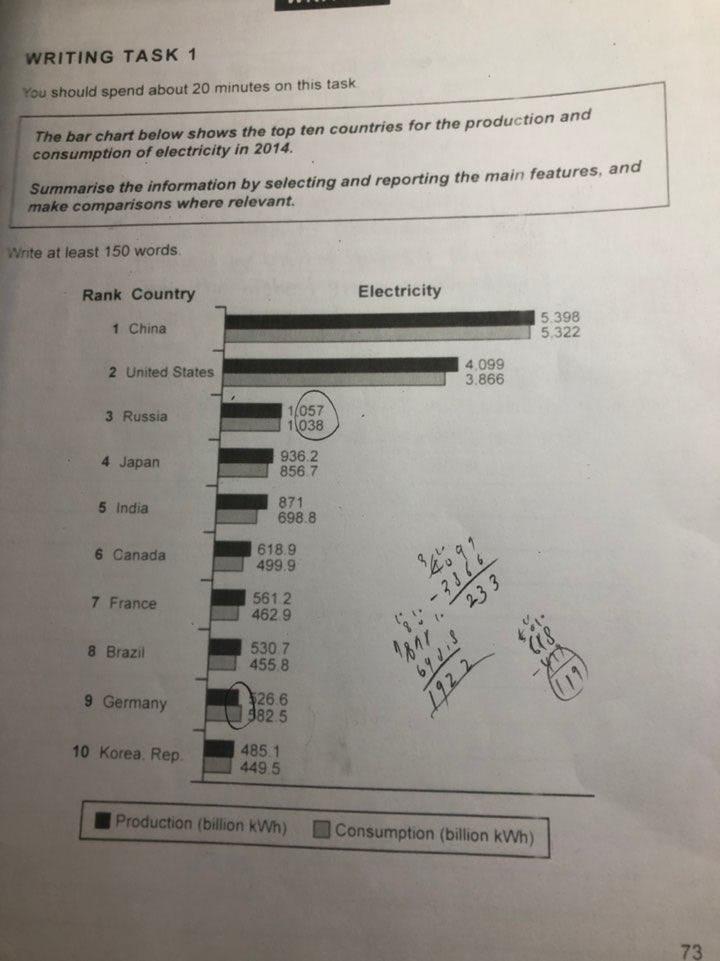
The bar graph compares ten countries ranked in the rate amount (비율과는 상관이 없습니다. 밑의 proportion, rate 등도 다 바꿔주시면 돼요.) of using and producing electricity in 2014.
Roughly speaking, all of the countries in the given question indicates that the gap was less between the usage and production of electricity. Among them, it is Russia which represents to represent the least difference, on the contrary, the United States had the most. In addition, the amount of making electricity gradually decreased whenever each countries’ position went down.
Looking at the graph more closely, the proportion of China china in two categories ascended at the top spot in 2014, followed by United States. The share of Russia fell into the biggest group as the third in the amount used and generated in 2014, However, Russia had a lower rate than china and the united states (대문자 시작해주세요~) combined. The only state in the given countries is Germany whose the aggregate of consuming electricity in 2014 was higher than that of making electricity is Germany.
총평: (6/6/6/6) 6.0
문법/어휘 모두 rate 등의 사용이나, 대소문자 관련 문제만 없었어도 충분히 7점으로 올라갈 수 있어서 더 아쉬웠네요. 특히 대소문자에서 까이면 정말 억울하니까 꼭 지켜주시고, 표에서 비율을 보여주는 경우와 절대적인 수치 (지금과 같이) 를 보여주는 경우로 나뉘는데, 이때 사용할 수 있는 어휘를 확실히 구분해주셔야 합니다. 수고하셨습니다 :)

 비밀번호 확인
 댓글 0개
댓글 0개


 불편사항 신고