


 인쇄
인쇄


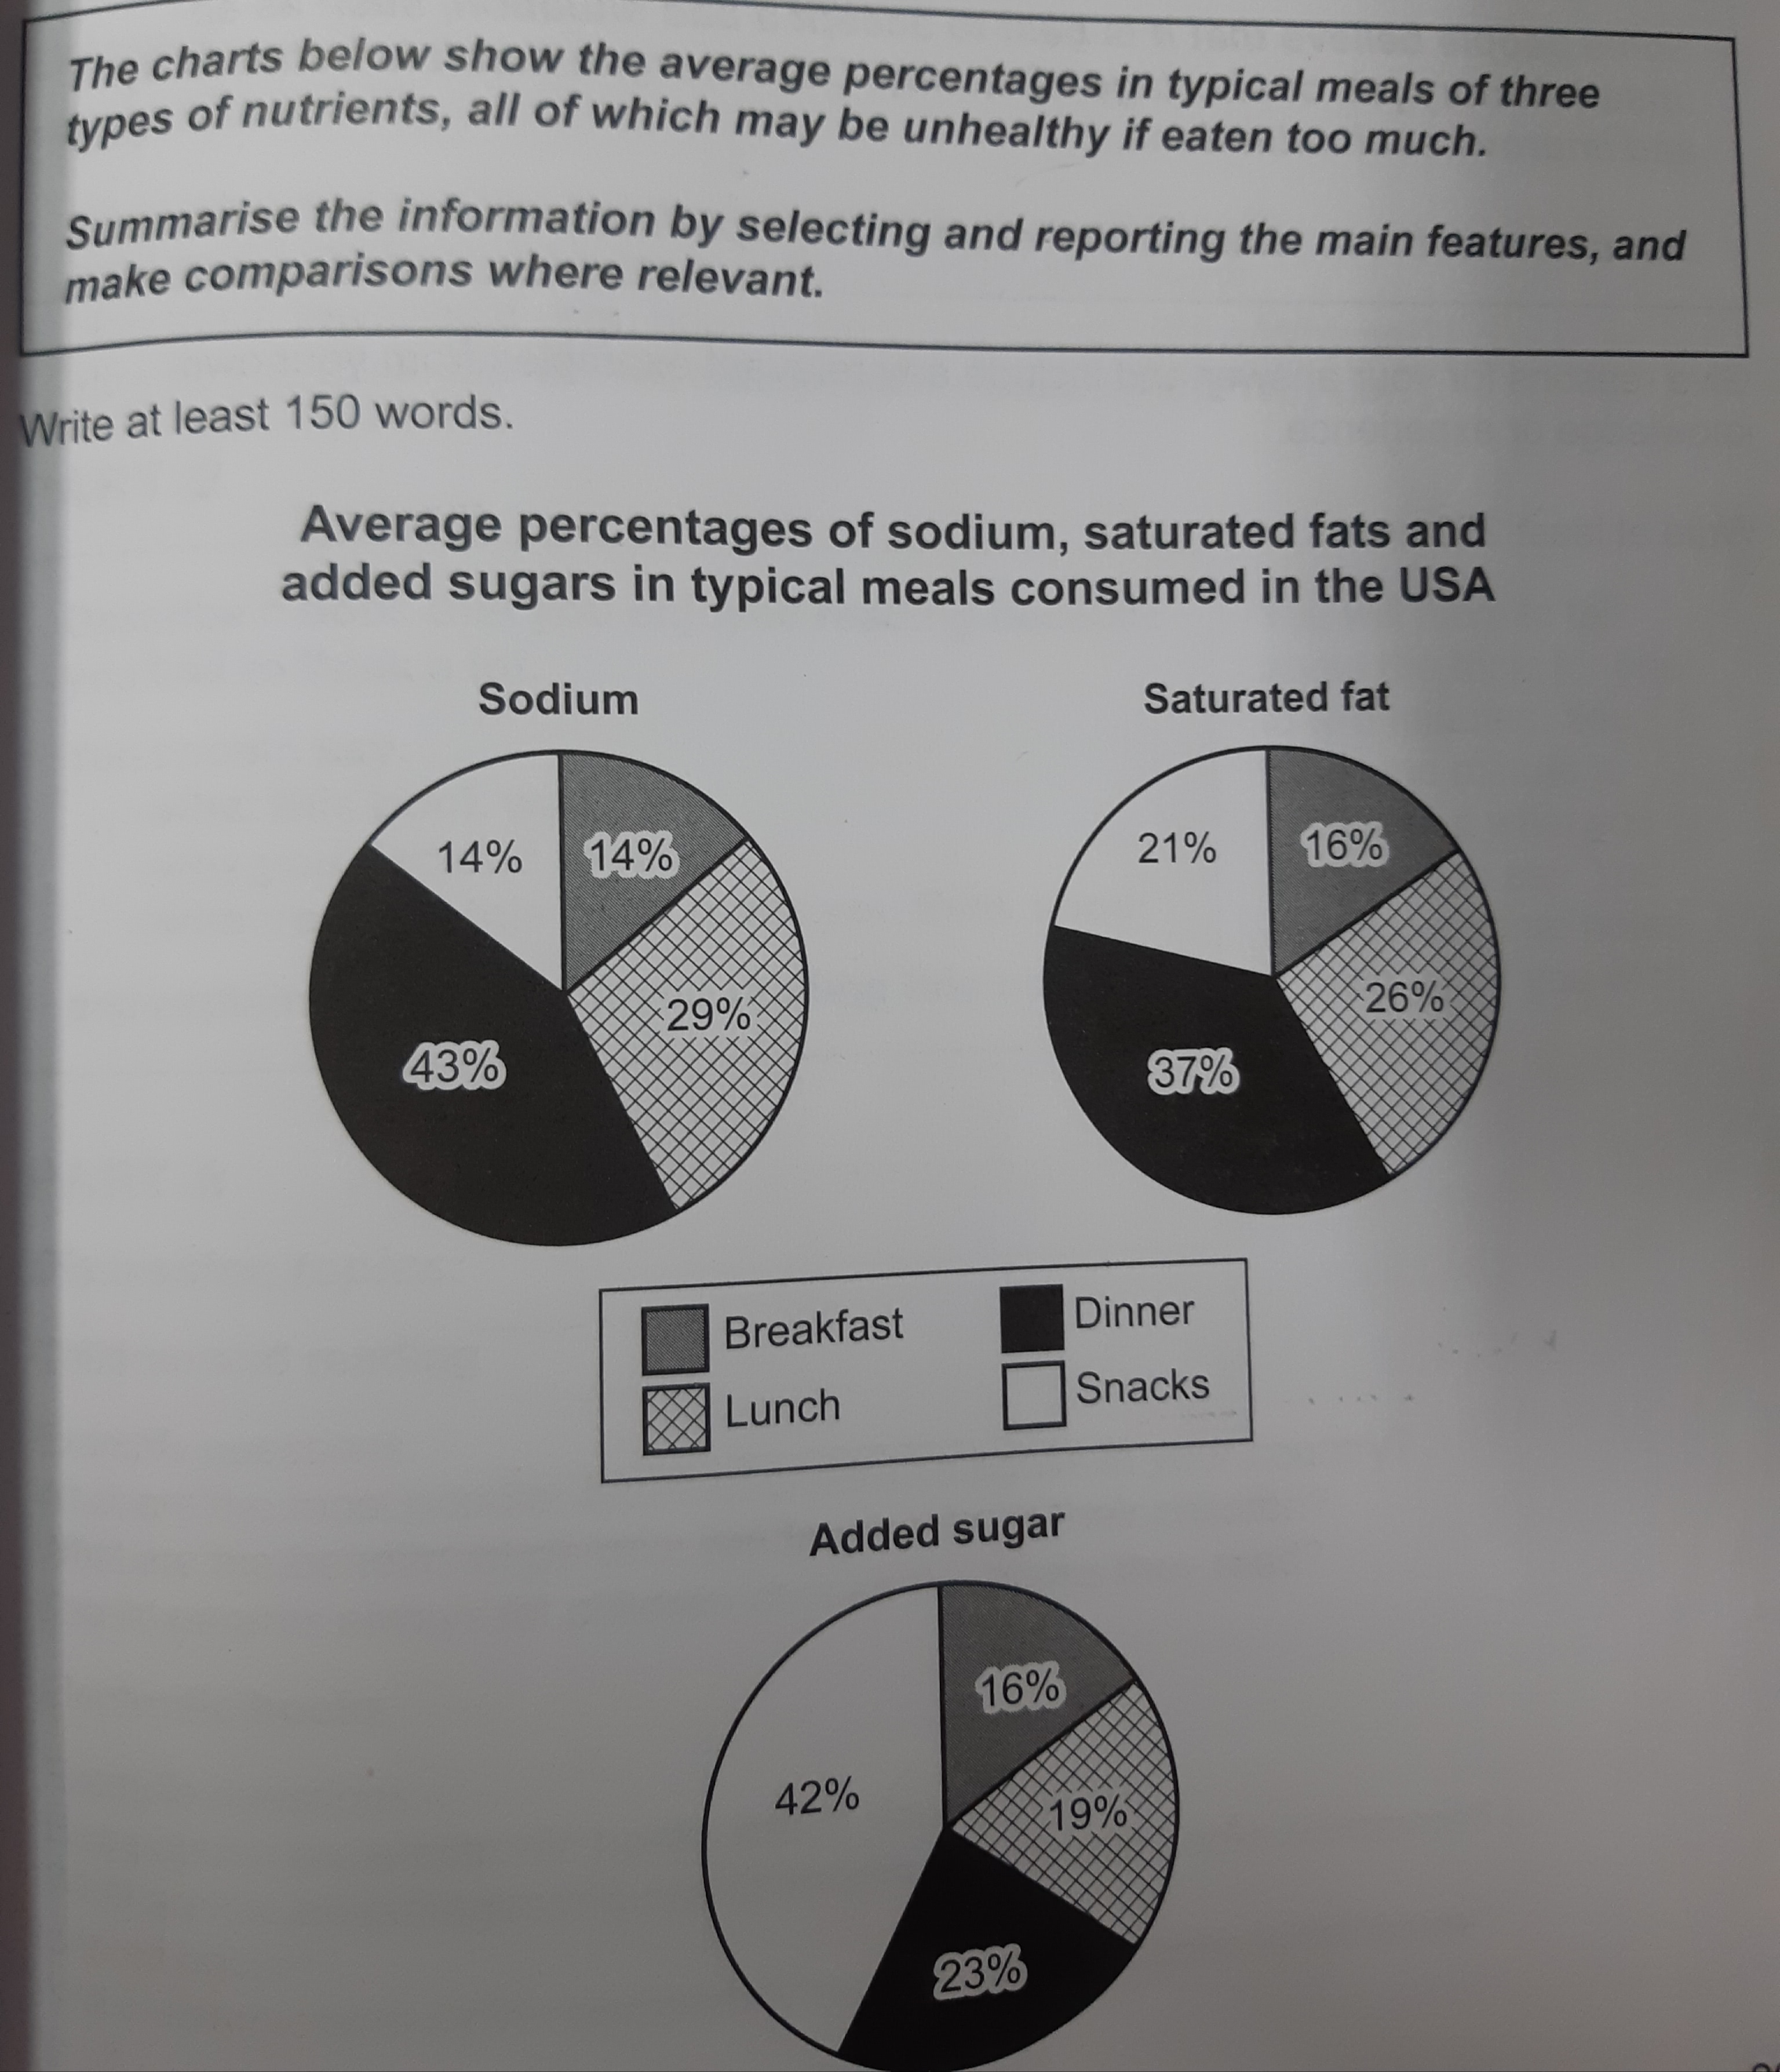
The pie charts illustrate the average
percentage of three types of nutrients which are sodium, saturated fats and
added sugars, all may be unhealthy if eaten too much, in typical four meals
consumed in the USA.
Overall, it is apparent that biggest amount
of sodium and saturated fat are consumed in dinner over the given charts, while
almost of added sugar is eaten for snacks.
The notable feature is that the charts of sodium
and saturated fats are showing similar pattern. They are both most consumed in
dineer with around 40 percent, and following by lunch with 29 and 26 percent respectively.
Another remarkable feature is that American had sodium with same proportion in
snacks and breakfast with 14 percent. However, in the case of saturated fats, it
eaten 5 percent more in snacks than breakfast, 16 percent.
As you can see in the average percentage of
added sugar consumed in America, it displays totally different trend with others.
Most different factor is that they eaten by American most in snacks with
percent of almost half. Then second meal is dinner in 23 percent which about nearly
half percentage of sodium. Then the left breakfast and lunch show similar
proportion of consumption with 16 and 19 percentage each.
목표점수 6.0
다음 시험 예정 1월 15일
이전 점수 12월 1일에 보고 5.5
시간재고 도움없이 작성했습니다

 댓글 0개
댓글 0개


 불편사항 신고