


 인쇄
인쇄


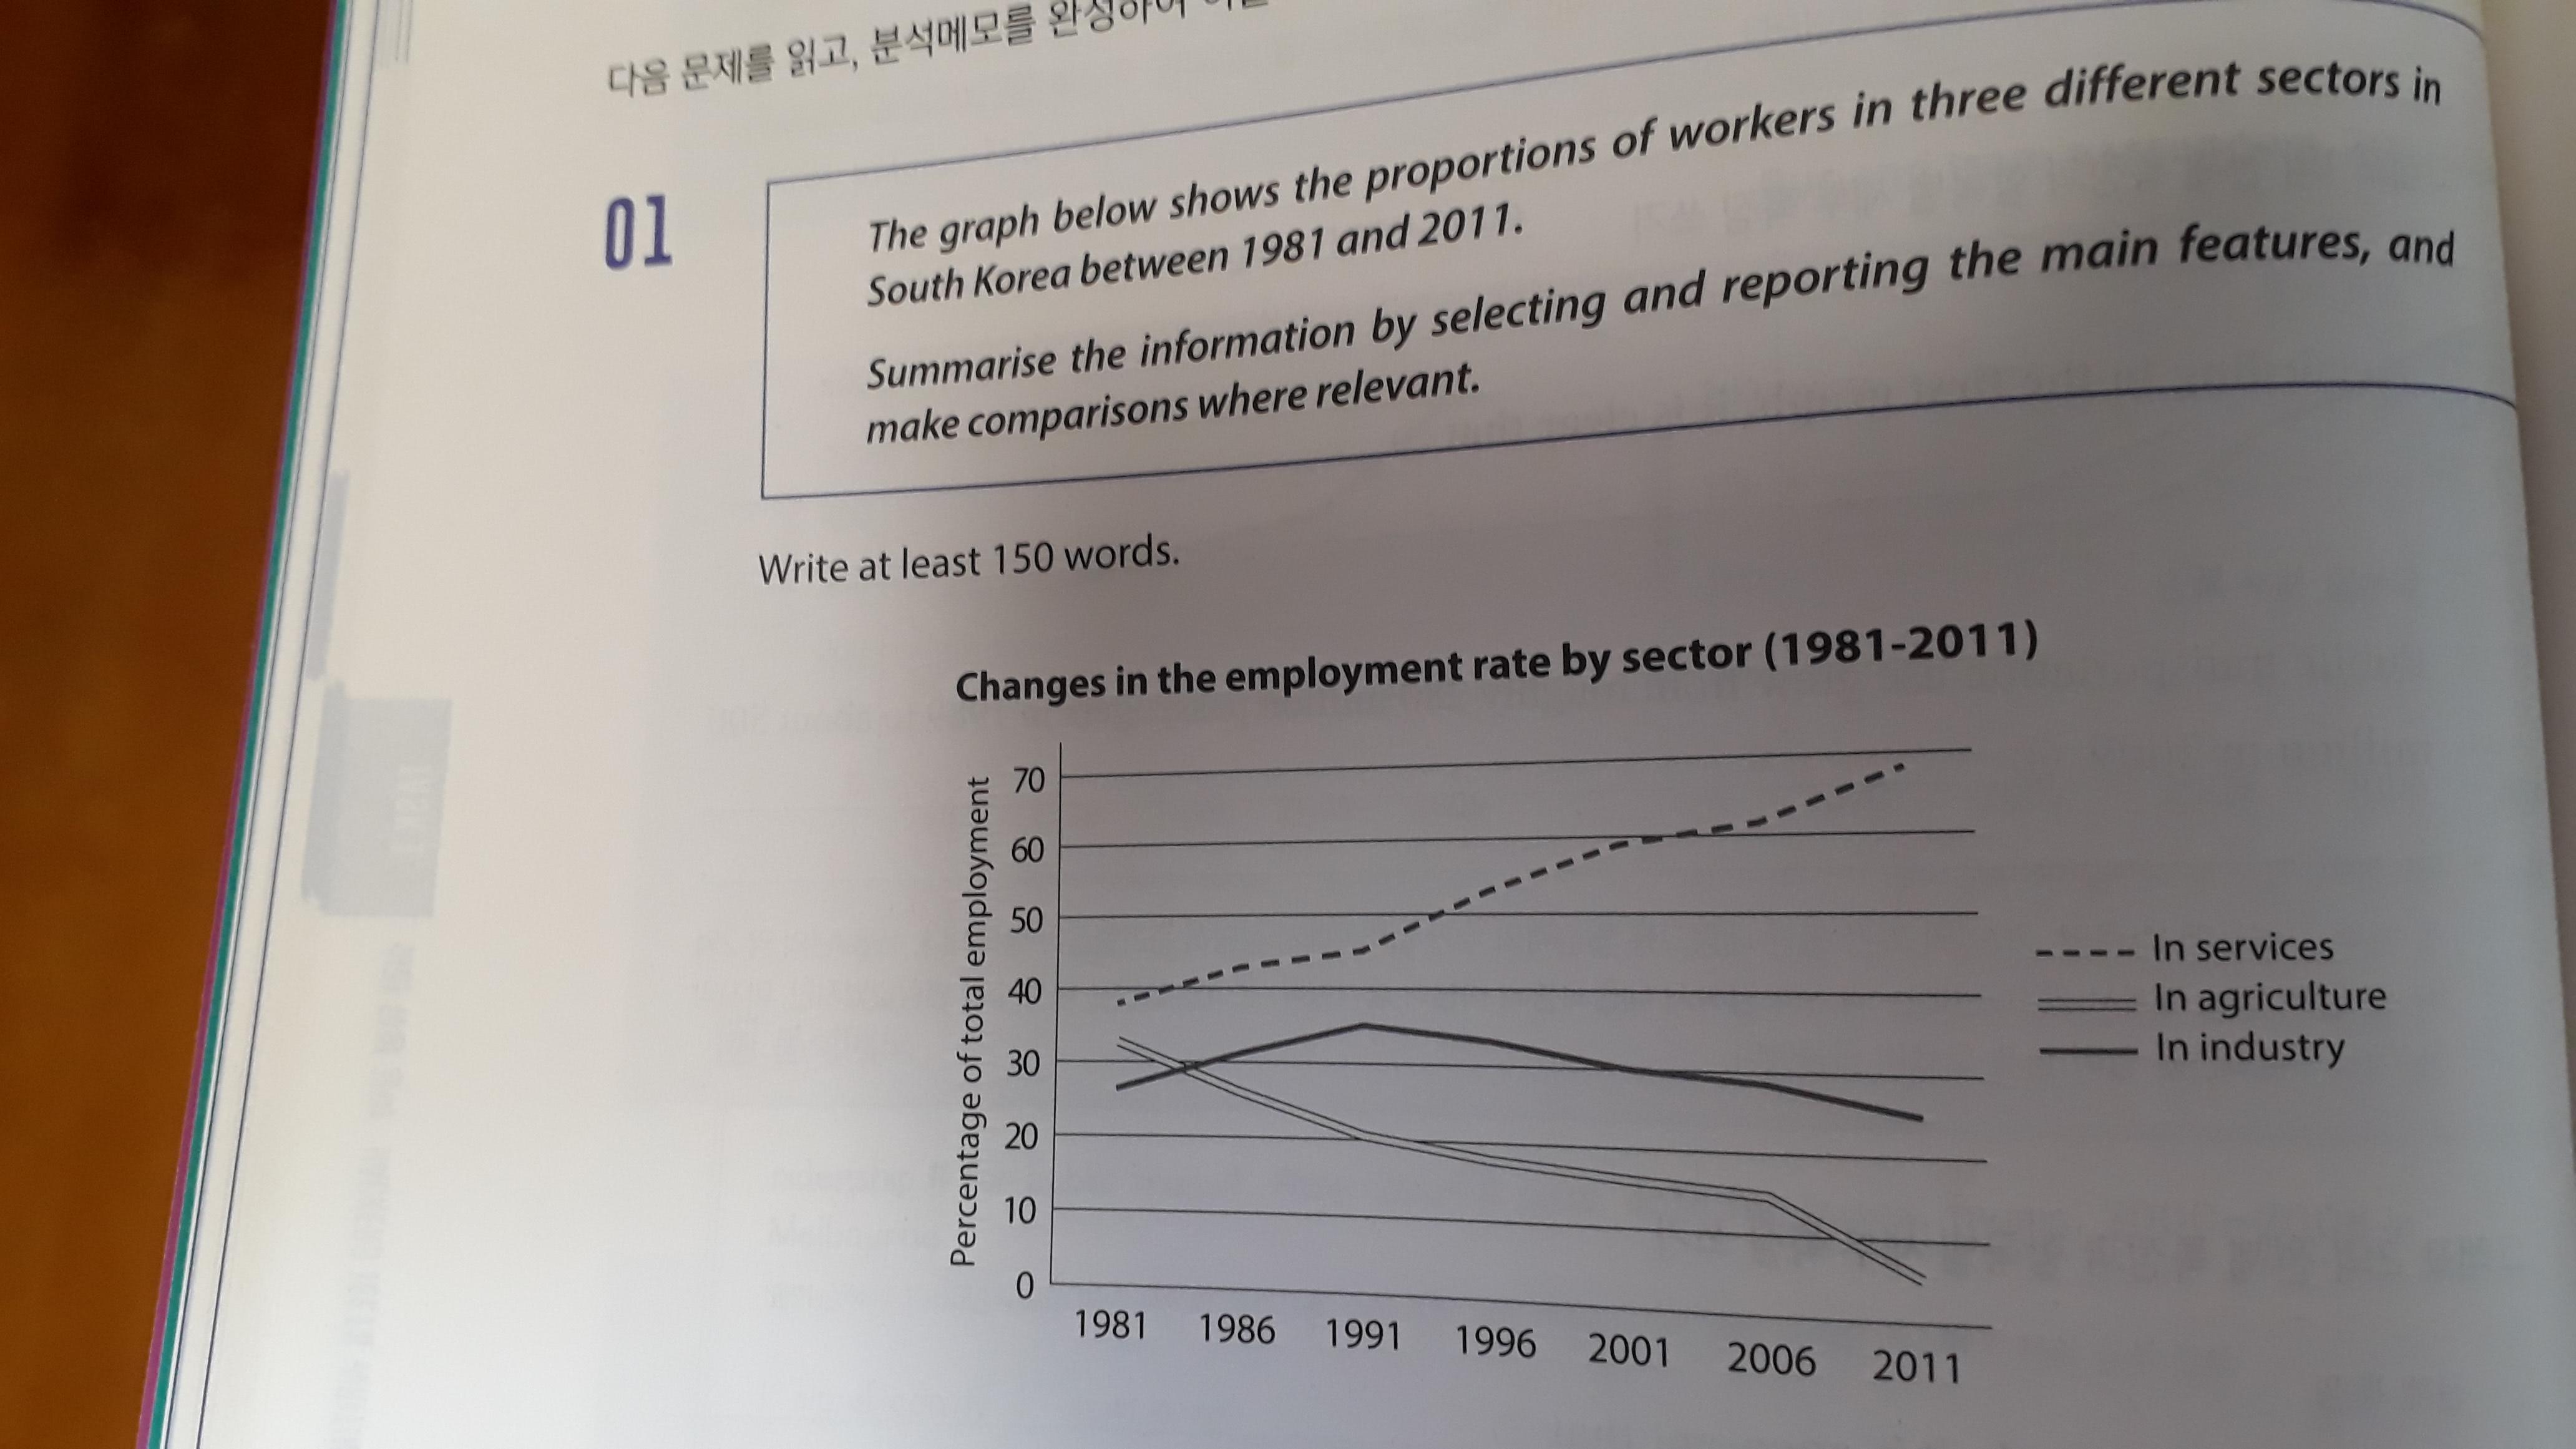
The chart illustrates the percentage of employees in three different categories in South Korea over the period from 1981 to 2011.
Overall, the proportions of employees in services reported by far the greatest figures throughout entire research period, while other sections changed their rank.
As clearly seen from the chart, the figure for workers in services was the highest by about 50% at the beginning of the period, continuing to rose to almost 70%.
On the contrary, the percentage of people who work in agriculture dropped significantly from around 32% to 5% over 30-year period.
Turning to employment rate in industry, the figure remained stable by approximately an average of 30% throughout whole period, overtaking that in agriculture in about 1984. Also, the figure in industry reached a peak of roughly 35%, which is about half of that in services at the end of the period.
목표점수: 6.0
다음시험: 2/8
걸린시간: 20분
아무도움 없이 함. 글자수는 146자.
내용이 살짝 부실한거 같아서 agriculture 수치가 1996년도 즈음에 절반이 되었다는 것을 분사구문이나 with 구문으로 쓰려고 하는데 어떻게 생각하세요??
아 그리고 평가점수 네 개 쓰실 때 각각이 무엇에 대한 점수인지 순서대로 알려주시면 감사하겠습니다!

 댓글 0개
댓글 0개


 불편사항 신고