


 인쇄
인쇄


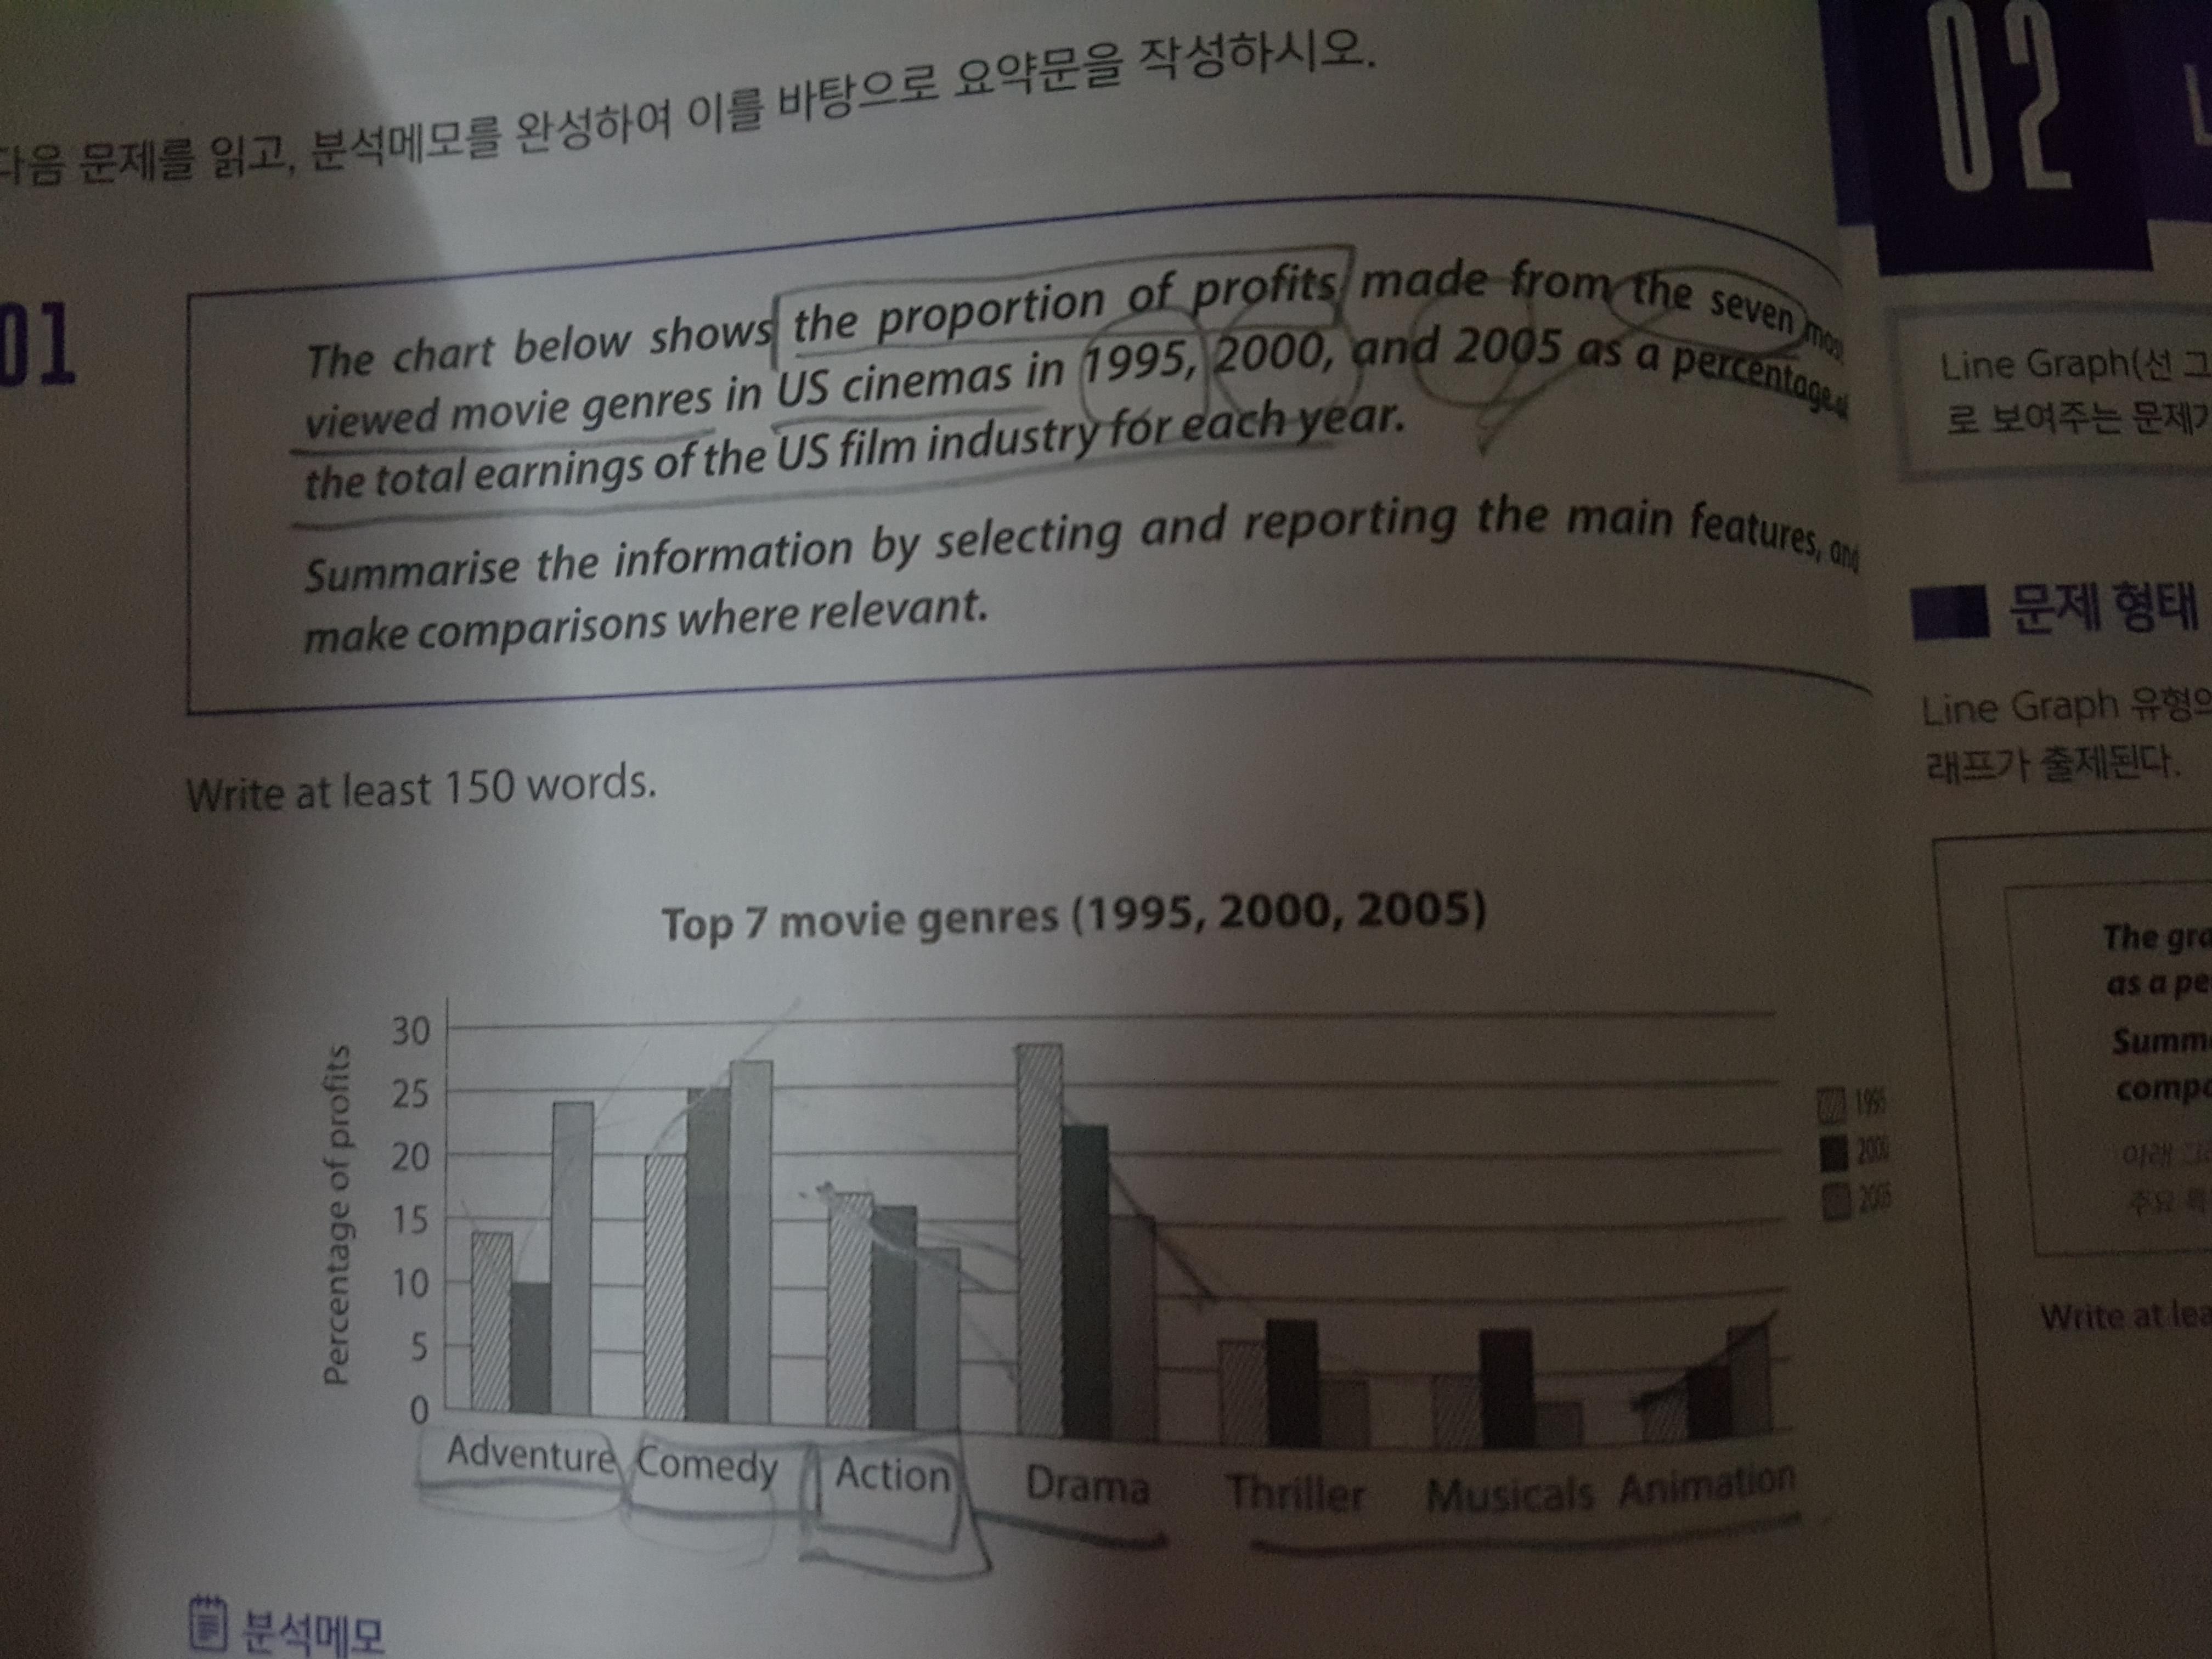
The given bar chart illustates the proportiong of profits compared to the thtal earning in US movies in seven genres in 1995, 2000 and 2005. Those five genres are Adventure, COmedy, Action, Drama, Thriller, Musicals and Animation.
Overall, it is clear that the percantage of profit in Drama and Action decreased constantly over 10-year period in question, while the proportion of profit in Comedy and Animation increased gradually from 1995 to 2005. Even though Adventure had a low of profit in 2003 before soaring tp roughly 25%, Thriller and Musicals decreased in 2005 after having a peak in 2005.
Looking at the chart more closely, it is apparent that the profit of Drama had roughly a third of all profit in US cinema in 1995, which was bigger that the combination of portion of three genres; Triller, Musicals and Animation. On the other hand, in 2000, the portion of Comedy had surpassed that of Drama by increasing about 10 percent from 1995 to 2000. The major genre like Adventure, Action and Drama had decreased in 2000, while other genres of Thriller and Musicals incresed slightly. At the last, in 2005, the portion of Adventure sored from 10 percent in 2000 to roughly 25 percent in 2005, which occupied the second portion of all profits of the US cinema. The percentage of comedy increased constantly from 1995 to 2005, which was similar to the portion of Dramam in 1995 when it was a peak in the proporion of the profit of the American cinema compared to other movie groups.

 댓글 0개
댓글 0개


 불편사항 신고