


 인쇄
인쇄


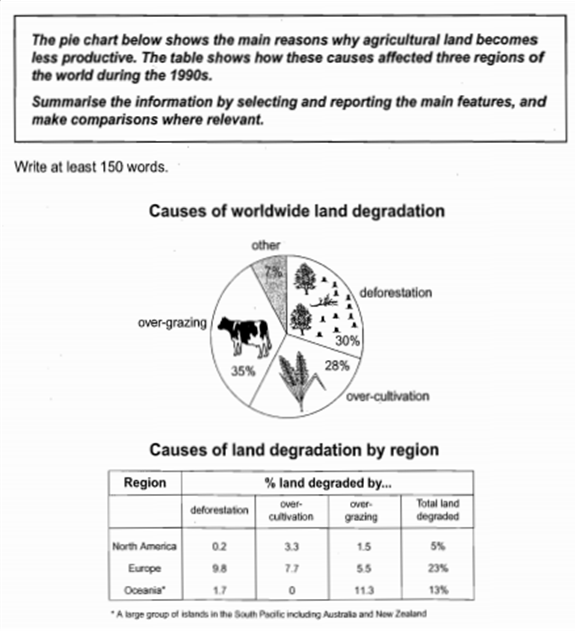
The given pie chart illustrate the main reasons about the change of agricultural land and there are infomation on the effect of these causes in three regions of the world in 19990s. (철자, 연도 틀리지 않도록 주의해주시고, 또한 이 부분은 the table ~ 로 시작되도록 수정해주시면 됩니다.)
Overall, it is clear that the main culprit of the change in agricultural land was over-grazing in a given bar chart. (1. 첫 번째 표의 경우 세 항목이 큰 차이를 보이지 않으니까 얘네 셋을 메인으로 삼아주시면 됩니다. 2. 두 번째 표에 대한 구체적인 요약도 해주세요~)
According to given table chart, Europe countries had the most influence on land degradation negatively. In detail, 35% of total accounted for the reasons of over-grazing which was the biggest figure. The deforestation followed it at 30%. The percentage of 28% was seen in the reason of over-cultivation. Remaining ratio of 7% made up other. (파란색은 첫 번째 표, 초록색은 두 번째 표 관련 내용입니다. 둘은 전혀 상관이 없는데 그걸 마치 상관이 있는 것처럼 in detail ~ 로 이을 경우 엄청난 감점을 감수하셔야해요.)
Meanwhile, Europe shown mostly higher in three sectors, among them, the figure for deforestation was the highest at 9.8%. The most (most highest 라는 표현은 없습니다.) highest percentage in over-grazing was seen in Oceania at 11.3%. Interestingly,i n category of over-cultivation accounted for 0% which was the lowest rate in all figures. In case of North America, all sector was under 4 unlikely (이 글을 읽으시는대로 꼭 unlike 와 unlikely 의 차이를 정리해서 익혀주세요!) other regions.
총평: 표에 대한 완벽한 이해가 되지 않으신 것 같은데, 특히 세 번째 문단에서는 서로 연관지어서는 안 되는 것을 연관짓고 있기 때문에 적절하지 않습니다. 어차피 문법+어휘가 중요하니까 3차까지 가실 필요는 없지만, 그래도 실전에서는 주어진 표가 정확히 뭘 보여주고자하는지를 최대한 정확하게 파악해주세요~수고하셨습니다 :)

 비밀번호 확인
 댓글 0개
댓글 0개


 불편사항 신고