


 인쇄
인쇄
| |
| |
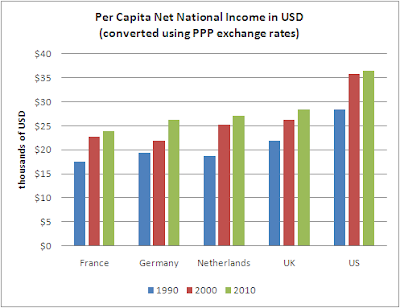
The bar graph illustrates the five different nations’ national income in USD per capita from 1990 to 2010.
Overall, all countries’ net national income per capita has risen and among all, France had the lowest national income per capita. The highest national income per capita was dedicated to the US whereas the national income per capita for the rest of countries reached about the similar level by 2010 except for France.
The US had the highest national income per capita in 1990 despite the income level was reached at about $28,000 per capita which increased substantially to more than $35,000 per capita by 2000. Meanwhile, the UK had about $22,000 national income per capita in 1990 which increased by about $4,000 per capita in 2000. By 2010, the US national income per capita remained at its dominant rate of about $36,000 income per capita whereas the UK increased its national income per capita to close to $28,000 by 2010.
In contrast, the rest of countries started at similar level of above $15,000 income per capita except for Germany which recorded at close to $20,000 income in 1990. Ten years later, the national income increased drastically where it reached at well over $20,000 income per capita for France and $25,000 per capita for Netherlands whereas German’s national income grew slightly just over $20,000 per capita. This incremental trend continued until 2010, Germany and Netherlands reached at similar income per capita of above $25,000 per capita whereas France reached at below $25,000 income per capita.
|

해커스그룹 사이트 리스트
- 방문자 수 1위 유학 커뮤니티랭키닷컴 유학/어학연수 분야 기준
방문자수 1위, 2021년 1월 3,4주 기준 - 해커스어학원
- 해커스인강
- 해커스 유학컨설팅
- 해커스 사업군 전체보기 >

주요메뉴 시작
본문시작
IELTS
- IELTS 단기 고득점 비법
- IELTS 정보
- 유용한 학습컨텐츠

딸기스무디 |
조회 1002
| 추천 5
- 2016.08.17


♨ 실시간 아이엘츠 Q&A 인기글 ♨
① WR/SP 문법 감점 클까?
☞ https://gouk.kr/iA0BvG ② ★무료 스피킹 첨삭★
☞ https://gouk.kr/J3Hger ③ 한달만에 오버롤 7.0 가능?
☞ https://gouk.kr/ucH0gm
① WR/SP 문법 감점 클까?
☞ https://gouk.kr/iA0BvG ② ★무료 스피킹 첨삭★
☞ https://gouk.kr/J3Hger ③ 한달만에 오버롤 7.0 가능?
☞ https://gouk.kr/ucH0gm

 댓글 0개
댓글 0개


| 번호 | 제목 | 글쓴이 | 조회수 | 날짜 |
|---|---|---|---|---|
| 42473 |
 [첨삭]
본론2를 보완해주세요 :) [첨삭]
본론2를 보완해주세요 :)

|
Eclipse_CS | 174 | 2021.04.14 |
| 42472 |
[첨삭]
첨삭부탁드립니다.
|
jsty | 145 | 2021.04.11 |
| 42471 |
[첨삭]
자잘한 부분만 수정해주시면 됩니다 :)
|
Eclipse_CS | 136 | 2021.04.14 |
| 42470 |
[Task1]
task1 첨삭 부탁드립니다! 감사합니다!! :)
|
candoielts | 184 | 2021.04.11 |
| 42469 |
[첨삭]
의미가 달라지지 않도록 주의해주세요 :)
|
Eclipse_CS | 142 | 2021.04.14 |
| 42468 |
[Task1]
task 1 첨삭 부탁드립니다! 감사합니다
|
indeon | 150 | 2021.04.11 |
| 42467 |
[첨삭]
대소문자를 정확히 구분해주세요 :)
|
Eclipse_CS | 157 | 2021.04.14 |
| 42466 |
[Task2]
첨삭부탁드립니다.
|
rlooko | 155 | 2021.04.11 |
| 42465 |
[첨삭]
줄임말은 풀어써주셔야 합니다 :)
|
Eclipse_CS | 155 | 2021.04.14 |
| 42464 |
[Task2]
첨삭부탁드립니다.
|
rlooko | 156 | 2021.04.11 |
| 42463 |
[첨삭]
자잘한 오류를 수정해주세요 :)
[2] |
Eclipse_CS | 161 | 2021.04.14 |
| 42462 |
[Task1]
첨삭 부탁드립니다 :) 항상 감사해요
|
orange | 120 | 2021.04.11 |
| 42461 |
[첨삭]
서론을 넣어주세요 :)
|
Eclipse_CS | 169 | 2021.04.14 |
| 42460 |
[Task1]
첨삭 부탁드립니다~ 미리 감사드려요~^^
|
고고시원 | 144 | 2021.04.11 |
| 42459 |
[첨삭]
Overview를 수정해주세요 :)
|
Eclipse_CS | 120 | 2021.04.14 |
| 42458 |
[Task2]
첨삭 부탁드립니다~ 미리 감사드려요~^^
|
고고시원 | 159 | 2021.04.11 |
| 42457 |
[첨삭]
자잘한 부분만 수정해주시면 됩니다 :)
|
Eclipse_CS | 157 | 2021.04.14 |
| 42456 |
[Task2]
첨삭 부탁드려용!!
|
눈누냔나 | 154 | 2021.04.11 |
| 42455 |
[첨삭]
자잘한 오류를 수정해주세요 :)
|
Eclipse_CS | 115 | 2021.04.14 |
| 42454 |
[Task1]
TASK1 첨삭 부탁드립니다!!
|
4월 | 137 | 2021.04.11 |


고우해커스는 유익한 게시판 이용을 위해 아래와 같은 내용을 포함한 게시글/댓글의 등록을 금지합니다.

고우해커스는 어학시험 분야 베스트셀러 교재의 정보를 제공합니다. 열기 버튼을 클릭하면 해커스 교재 순위를 확인할 수 있습니다.
열기 ▼
해커스 교재 순위 (2023/06/28 기준)
-
TOEIC/TOEFL 종합 월간 베스트 1위 / 외국어 종합 베스트셀러 1위 (교보문고 종합 월간 베스트 TOEIC/TOEFL 부분 1위 (2023년 1월 기준))
TOEIC/TOEFL 종합 주간 베스트 1위 / 외국어 종합 베스트셀러 1위 (교보문고 종합 주간 베스트 TOEIC/TOEFL 부분 1위 (2023년 2월 2주 기준)
[해커스 토플 리딩 베이직] 알라딘 외국어 토플 Listening 분야 베스트셀러 1위 (2022년 12월 4주차 주간베스트 기준)
[해커스 토플 리스닝 베이직] 알라딘 외국어 토플 Listening 분야 베스트셀러 1위 (2022년 12월 4주차 주간베스트 기준)
[해커스 토플 스피킹 베이직] 알라딘 외국어 토플 Speaking 분야 베스트셀러 1위 (2022년 10월 1주차 주간베스트 기준)
[해커스 토플 라이팅 베이직(2nd)] 알라딘 외국어 토플 Writing 분야 베스트셀러 1위 (2022년 10월 5주차 주간베스트 기준)
[해커스 토플 리딩 인터미디엇] 알라딘 외국어 토플 Reading 분야 베스트셀러 1위 (2022년 12월 5주차 주간베스트 기준)
[해커스 토플 리스닝 인터미디엇] ⓐ 알라딘 외국어 토플 베스트셀러 Listening 분야 1위 (2021년 12월 월간 베스트 기준) ⓑ 알라딘 외국어 토플 Listening 분야 베스트셀러 1위 (2022년 10월 4주차 주간베스트 기준)
[해커스 토플 스피킹 인터미디엇] 알라딘 외국어 토플 Speaking 분야 베스트셀러 1위 (2022년 12월 5주차 주간베스트 기준)
[해커스 토플 라이팅 인터미디엇] 알라딘 외국어 토플 Writing 분야 베스트셀러 1위 (2022년 10월 4주차 주간베스트 기준)
[해커스 토플 리딩] 교보문고 외국어 베스트셀러 토플(TOEFL) R/C 분야 1위 (2023.01.05, 온라인주간베스트 기준), 알라딘 외국어 토플 분야 베스트셀러 1위 (2022년 역대베스트 기준), 알라딘 외국어 토플 Reading 분야 베스트셀러 1위 (2022년 12월 4주차 주간베스트 기준)
[해커스 토플 리스닝] 교보문고 외국어 베스트셀러 토플(TOEFL) L/C 분야 1위 (2023.01.05, 온라인주간베스트 기준), 알라딘 외국어 토플 베스트셀러 Listening 분야 1위 (2022년 5월 월간 베스트 기준), 알라딘 외국어 토플 Listening 분야 베스트셀러 1위 (2022년 12월 3주차 주간베스트 기준)
[해커스 토플 스피킹] 교보문고 외국어 베스트셀러 토플(TOEFL) Speaking 분야 1위 (2023.01.05, 온라인주간베스트 기준), 알라딘 외국어 토플 베스트셀러 Speaking 분야 1위 (2022년 5월 월간 베스트 기준), 알라딘 외국어 토플 Speaking 분야 베스트셀러 1위 (2022년 12월 4주차 주간베스트 기준)
[해커스 토플 라이팅] 교보문고 외국어 베스트셀러 토플(TOEFL) Writing 분야 1위 (2023.01.05, 온라인주간베스트 기준), 알라딘 외국어 토플 베스트셀러 Writing 분야 1위 (2022년 5월 월간 베스트 기준), 알라딘 외국어 토플 Writing 분야 베스트셀러 1위 (2022년 12월 5주차 주간베스트 기준)
[해커스 토플 액츄얼테스트 리딩] 교보문고 TOEIC/TOEFL 분야 베스트셀러(2019.08.05 온라인 주간 집계 기준),YES24 국어/외국어 사전 영어-TOEFL/SAT/GRE 유학관련서 분야(2019년 8월 1주 YES24 주별 베스트기준),알라딘 외국어 토플 베스트셀러 실전 분야 (2019년 8월 1주 주간 베스트 기준)
[해커스 토플 액츄얼테스트 리스닝] 알라딘 외국어 토플 Listening 분야 베스트셀러 1위 (2022년 8월 5주차 주간베스트 기준), 교보문고 TOEIC/TOEFL 분야 베스트셀러(2019.08.05 온라인 주간 집계 기준),YES24 국어/외국어 사전 영어-TOEFL/SAT/GRE 유학관련서 분야(2019년 8월 1주 YES24 주별 베스트기준),알라딘 외국어 토플 베스트셀러 실전 분야 (2019년 8월 1주 주간 베스트 기준)
[해커스 토플 액츄얼테스트 스피킹] 알라딘 외국어 토플 Speaking 분야 베스트셀러 1위 (2021년 5월 4주차 주간베스트 기준)
[해커스 토플 액츄얼 테스트 라이팅] 알라딘 외국어 토플 Writing 분야 베스트셀러 1위 (2021년 3월 4주차 주간베스트 기준)
[해커스 보카 (2nd)] YES24 국어 외국어 사전 베스트셀러 TOEFL/SAT/GRE 유학관련서 분야 1위 (2023.01.05 YES24 베스트셀러 기준)
[스타토플 실전 라이팅] 교보문고 베스트셀러 TOEIC/TOEFL 분야 (2019.07.17 인터넷 주간 베스트 기준)
[스타토플 실전 스피킹] 교보문고 외국어 베스트셀러 토플(Toefl)분야(2019.08.05, 온라인 주간집계 기준
[리딩 인트로] 알라딘 외국어 베스트셀러 영어독해분야 (2018년 12월 5주, 주간 베스트 기준)
[리스닝 인트로] 알라딘 외국어 베스트셀러 1위 영어듣기/말하기 분야 1위 (2018년 12월 5주, 주간 베스트 기준)
[리딩 스타트] YES24 국어 외국어 사전 베스트셀러 영어독해/번역 분야(2019년 10월 4주차 주별 베스트 기준)
[리스닝 스타트] YES24 국어 외국어 사전 베스트셀러 영어 청취/발음 분야(2019년 8월 2주 주별 베스트 기준)
[라이팅 스타트] YES24 국어 외국어 사전 베스트셀러 영작문 분야 1위(2017년 2월 4주, 주별베스트 기준)
[그래머 스타트] 알라딘 토플 베스트셀러 Grammar 분야 1위(2019년 8월 2주, 주간베스트 기준)
[스타 아이엘츠 실전 Writing (Academic Module)] YES24 국어 외국어 사전 베스트셀러 IELTS 분야(2021년 1월 1주, 주별 베스트 기준)
[해커스 아이엘츠 베이직 리딩] YES24 국어외국어사전 IELTS 분야 1위(2018년 5월 1주 YES24 주별 베스트 기준),YES24 국어 외국어 사전 베스트셀러 IELTS 분야(2021년 1월 1주, 주별 베스트 기준)
[해커스 아이엘츠 베이직 리스닝] YES24 국어외국어사전 IELTS 분야 1위(2018년 6월 1주 YES24 주별 베스트 기준),YES24 국어 외국어 사전 베스트셀러 IELTS 분야(2021년 1월 1주, 주별 베스트 기준)
[해커스 아이엘츠 베이직 라이팅] 교보문고 외국어 수험영어 베스트셀러 SAT/GRE/GMAT/IELTS 분야 1위 (2022.06.14 온라인 주간 집계 기준)
[해커스 아이엘츠 베이직 스피킹] YES24 국어 외국어 사전 베스트셀러 IELTS 분야(2021년 1월 1주, 주별 베스트 기준)
[해커스 아이엘츠 리딩] 교보문고 외국어 베스트셀러 SAT/GRE/GMAT/IELTS 분야 1위 (2023.01.05, 온라인주간베스트 기준)
[해커스 아이엘츠 리스닝] 교보문고 외국어 베스트셀러 SAT/GRE/GMAT/IELTS 분야 (2020.10.06, 온라인 주간 집계 기준)
[해커스 아이엘츠 라이팅] 교보문고 외국어 베스트셀러 SAT/GRE/GMAT/IELTS 분야 1위 (2021.01.04 온라인 주간 집계 기준)
[해커스 아이엘츠 스피킹] YES24 국어외국어사전 IELTS 분야 1위(2018년 2월 4주 YES24 주별 베스트 기준),교보문고 외국어 베스트셀러 SAT/GRE//GMAT/IELTS 분야(2021.01.04, 온라인 주간 집계 기준)
[해커스 토익 기출 보카] 토익 분야 1위, 교보문고(2020.03.12, 인터넷 주간 베스트 기준), YES24/반디앤루니스/알라딘(2020년 3월 2주, 주별/주간 베스트 기준),인터파크(2020.03.12, 주간 베스트셀러 기준), 영풍문고(2020년 3월 1주, 주간 베스트셀러 기준)
알라딘 국내도서 외국어 토익 Vocabulary 분야 베스트셀러 (2022.08.30 8월 4주 주간베스트기준))
[해커스 토익 왕기초 리딩] 알라딘 외국어 베스트셀러 토익 부분 (2020년 12월 4주 주간 베스트 기준)
[해커스 토익 왕기초 리스닝] 알라딘 외국어 베스트셀러 토익 부분 (2020년 12월 4주 주간 베스트 기준)
[해커스 첫토익 LC+RC+VOCA] YES24 국어 외국어 사전 베스트셀러 토익/TOEIC 분야 (2021년 05월 20일 기준)
[해커스 토익 스타트 리딩] YES24 국어 외국어 사전 베스트셀러 토익/TOEIC 분야(2019.12.20, YES24베스트셀러 기준)
[해커스 토익 스타트 리스닝] 알라딘 외국어 베스트셀러 토익 부분 (2020년 12월 4주 주간 베스트 기준)
[한 권으로 끝내는 해커스 토익 700+ (LC+RC+VOCA)] 교보문고 국내도서 외국어 수험영어 토익 종합 베스트셀러 1위 (23.05.08 온라인 주간베스트 기준)
알라딘 국내도서 외국어 토익 종합 분야 베스트셀러 1위 (2022.08.31 8월 4주 주간베스트 기준)
[20일 만에 끝내는 해커스 토익 RC] 알라딘 베스트셀러 외국어 부분 (2021년 7월 6일 신간베스트 기준)
[20일 만에 끝내는 해커스 토익 LC] 알라딘 베스트셀러 토익 부분 (2020년 12월 4주 주간 베스트 기준)
[한 권으로 끝내는 해커스 토익 실전 LC+RC 2023 최신개정판 (모의고사+해설집)] 교보문고 국내도서 외국어 수험영어 토익 모의고사/테스트 부문 베스트셀러 1위 (23.04.24 온라인 주간베스트 기준)
[해커스 토익 리딩] 교보문고 종합 베스트셀러 토익/토플 분야 토익 RC 기준 1위(2005~2021 연간 베스트셀러)
[해커스 토익 리스닝] 교보문고 종합 베스트셀러 토익/토플 분야 토익 LC 기준 1위(2005~2021 연간 베스트셀러)
[해커스 토익 실전 1200제 리딩] 알라딘 외국어 베스트셀러 토익 종합 분야 1위(2020년 8월 1주, 주간 베스트 기준)
[해커스 토익 실전 1200제 리스닝] 알라딘 외국어 베스트셀러 토익 실전 분야 1위(2020년 7월 4주, 주간 베스트 기준)
[해커스 토익 실전 1000제 1 리딩 문제집] yes24 국내도서 국어외국어사전 영어 토익/TOEIC 기출문제/모의고사 월별베스트 (2023년 2월 기준)
[해커스 토익 실전 1000제 2 리딩 문제집] 교보문고 토익/토플 분야 1위 (2021년 7월 8일 인터넷 일간 베스트 기준)
[해커스 토익 실전 1000제 3 리딩 문제집] 알라딘 외국어 베스트셀러 토익 실전 분야 1위(2017.2월 1주, 주간베스트 기준)
[해커스 토익 실전 1000제 3 리스닝 문제집] 알라딘 외국어 신간베스트셀러 1위(2017.1.9 신간베스트 기준)
[해커스 토익 실전 1000제 1 리딩 해설집] YES24 국어 외국어 사전 베스트셀러 기출문제/모의고사 분야(2019년 1월 4주 주별베스트)
[해커스 토익 실전 1000제 1 리스닝 해설집] YES24 국어 외국어 사전 베스트셀러 기출문제/모의고사 분야(2019년 1월 4주 주별베스트)
[해커스 토익 실전 1000제 2 리딩 해설집] YES24 국어 외국어 사전 베스트셀러 기출문제/모의고사 분야(2019년 1월 4주 주별베스트)
[해커스 토익 실전 1000제 2 리스닝 해설집] YES24 국어 외국어 사전 베스트셀러 기출문제/모의고사 분야(2019년 1월 4주 주별베스트)
[해커스 토익 실전 1000제 3 리딩 해설집] YES24 국어 외국어 사전 베스트셀러 기출문제/모의고사 분야(2019년 1월 4주 주별베스트)
[해커스 토익 실전 1000제 3 리스닝 해설집] YES24 국어 외국어 사전 베스트셀러 기출문제/모의고사 분야(2019년 1월 4주 주별베스트)
[해커스 토익 PART 7 집중공략 777] 알라딘 외국어 베스트셀러 토익 Grammar 분야(2018년 12월 4주, 주간베스트 기준)
[스타토익 필수 문법 공식 Part 5&6] 알라딘 외국어 베스트셀러 토익Grammar 분야 1위(2018.10월 1주, 주간베스트 기준)
[해커스 텝스 리딩] 교보문고 외국어 베스트셀러 텝스(Teps) 분야 (2021.01.22 온라인 주간집계 기준)
[해커스 텝스 리스닝] 교보문고 외국어 베스트셀러 텝스(Teps) 분야 (2021.01.22 온라인 주간집계 기준)
[TEPS 서울대 텝스관리위원회 공식 기출문제집] 국내 3대 서점 베스트셀러 1위 (3관왕 달성!) 교보문고 외국어 수험영어 텝스(Teps) 분야 베스트셀러 1위 (2023.02.10 온라인 주간 집계 기준), YES24 국어 외국어 사전 텝스 기출문제/모의고사 분야 1위 (2023.02.09 YES24 베스트셀러 기준), 알라딘 외국어 텝스 실전 분야 1위 (2023년 1월 5주차 주간 베스트 기준)
[해커스 중급 문법] YES24 국어 외국어 사전 텝스/TEPS 독해/문법/RC 분야 베스트셀러 1위 (2022년 5월 5주차 주별 베스트셀러 기준)
[해커스 중급 청해] YES24 국어 외국어 사전 텝스/TEPS 청해/LC 분야 베스트셀러 1위 (2022년 5월 5주차 주별 베스트셀러 기준)
[해커스 중급 독해·어휘] YES24 국어 외국어 사전 텝스/TEPS 독해/문법/RC 분야 베스트셀러 1위 (2022년 9월 1주차 주별 베스트셀러 기준)
[해커스 뉴텝스 최신기출유형 실전모의고사 문제집] 교보문고 외국어 베스트셀러 텝스(Teps) 분야 (2021.01.22 온라인 주간집계 기준)
[해커스 뉴텝스 최신기출유형 실전모의고사 해설집] 교보문고 외국어 베스트셀러 텝스(Teps) 분야 (2021.01.22 온라인 주간집계 기준)
[서울대 텝스관리위원회 공식 최신기출 1200제 1] [서울대 공식최신기출 1200제 1 문제집] YES24 국어외국어 사전 베스트셀러 기출문제/모의고사 분야 1위 (2017년 4월 3주 온라인주간집계 기준),[서울대 공식최신기출 1200제 1 해설집] 교보문고 토익토플 베스트셀러 (2018년 1월 21일~2018년 1월 26일)
서울대 텝스관리위원회 공식 최신기출 1200제 2 [서울대 텝스관리위원회 공식 최신기출 1200제 2 문제집] YES24 텝스 베스트셀러 텝스실전서 기준 1위 (2014년 8월 1주, 2014년 8월 3주~2014년 12월),[서울대 텝스관리위원회 공식 최신기출 1200제 2 해설집] YES24 국어/외국어 사전 영어-텝스/TEPS 분야 베스트셀러 기출문제/모의고사 분야 1위 (2017.10.2주~3주)
[서울대 텝스관리위원회 공식 최신기출 1200제 2 문제집] 교보문고 외국어 베스트셀러 텝스(Teps) 분야 (2021.01.22 온라인 주간집계 기준)
[서울대 텝스관리위원회 공식 최신기출 1200제 2 해설집] 교보문고 외국어 베스트셀러 텝스(Teps) 분야 (2021.01.22 온라인 주간집계 기준)
토스 전 교재/ 전체라인업 베스트셀러 교보문고 국내도서 외국어 수험영어 토익 Speaking (2022.10.13 기준)
[10일 만에 끝내는 해커스 토익스피킹(토스) 스타트 Lv. 6] YES24 토익Speaking & Writing Test/TOEIC S&W 베스트셀러 분야 (2021년 8월 5일 YES24 베스트셀러 기준)
[10일 만에 끝내는 해커스 토익스피킹(토스) Level. 7·8] 알라딘 토익 Speaking 분야 1위 (2021년 8월 1주 주간 베스트 기준)
[5일 만에 끝내는 해커스 토익스피킹(토스) 실전모의고사 15회] YES24 토익Speaking & Writing Test/TOEIC S&W 베스트셀러 분야 (2021년 8월 5일 YES24 베스트셀러 기준)
[만능 템플릿과 위기탈출 표현으로 해커스 토익스피킹 5일 완성] yes24 국어 외국어 사전 베스트셀러 영어 토익Speaking & Writing Test/TOEIC S&W 분야 (2022.09.14. yes24 주별 베스트 기준, 2022.09.08. 출간)
[2주 만에 끝내는 해커스 OPIc 오픽 START(Intermediate 공략)] 알라딘 외국어 베스트셀러 OPIc 분야 1위(2019년 9월 1주 주간 베스트 기준)
교보문고 국내도서 외국어 수험영어 OPIc (2022.08.29 온라인 주간집계 기준)
[2주 만에 끝내는 해커스 OPIc 오픽 Advanced 공략]
알라딘 OPic/인터뷰 영어 분야 (2021년 10월 6일, 주간 베스트 기준),알라딘 OPic/인터뷰 영어 분야 (2021년 10월 6일, 스테디셀러 기준)
[해커스어학연구소] 알라딘 외국어 베스트셀러 OPIc/인터뷰 영어 분야(2015~2022 역대베스트 기준)
교보문고 국내도서 외국어 수험영어 OPIc (2022.08.29 온라인 주간집계 기준)
[2023 10일만에 끝내는 해커스 OPIc 오픽 Advanced 공략] YES24 국내도서 국어외국어사전 영어 OPIC/G-TELP/ESPT 외 기타 영어어학시험 (23.06.07 YES24 베스트셀러 기준)
[서베이부터 실전까지 해커스 오픽 매뉴얼] 교보문고 외국어 분야 OPIc 부문 베스트셀러 (23.03.14, 온라인 주간베스트 기준), 알라딘 외국어 분야 OPIc 부문 베스트셀러 (2023년 3월 2주 주간베스트 기준)
[해커스 지텔프 기출문제집 LEVEL 2] YES24 국어/외국어/사전 베스트셀러 OPIC/G-TELP/ESPT 외 기타 영어 어학시험 분야 (2019년 7월 4주~2022년 4월 3주차 주별 베스트셀러 기준),es24 국어/외국어/사전 베스트셀러 OPIC/G-TELP/ESPT 외 기타 영어어학시험 분야 (2019년 7월 4주~2022년 1월 2주차 주별 베스트셀러 기준),교보문고 외국어 베스트셀러 G-Telp 분야 1위 (2021.09.01 온라인 주간 집계 기준),YES24 국어 외국어 사전 베스트셀러 OPIC/G-TELP/ESPT외 기타 영어어학시험 분야 (2021.09.13, YES24 베스트셀러 기준),알라딘 외국어 베스트셀러 G-TELP 분야 (2021년 9월 2주, 주간 베스트 기준)
[해커스 지텔프 독해 LEVEL 2 (개정2판)] 교보문고 외국어 베스트셀러 G-Telp 분야 (2021.09.01 온라인 주간집계 기준),YES24 국어 외국어 사전 베스트셀러 OPIC/G-TELP/ESPT외 기타 영어어학시험 분야 (2021.09.13, YES24 베스트셀러 기준),알라딘 외국어 베스트셀러 G-TELP 분야 (2021년 9월 2주, 주간 베스트 기준)
[해커스 지텔프 문법 LEVEL 2 (개정2판)] 교보문고 외국어 베스트셀러 G-Telp 분야 (2021.09.01 온라인 주간집계 기준),YES24 국어 외국어 사전 베스트셀러 OPIC/G-TELP/ESPT외 기타 영어어학시험 분야 (2021.09.13, YES24 베스트셀러 기준),알라딘 외국어 베스트셀러 G-TELP 분야 (2021년 9월 2주, 주간 베스트 기준)
[해커스 지텔프 기출 보카 (개정2판)] 교보문고 외국어 베스트셀러 G-Telp 분야 (2021.09.01 온라인 주간집계 기준),YES24 국어 외국어 사전 베스트셀러 OPIC/G-TELP/ESPT외 기타 영어어학시험 분야 (2021.09.13, YES24 베스트셀러 기준),알라딘 외국어 베스트셀러 G-TELP 분야 (2021년 9월 2주, 주간 베스트 기준)
[한 권으로 끝내는 해커스 지텔프(G-TELP) Level. 2: 32-50+ 문법+독해+어휘+청취특강] 교보문고 외국어 베스트셀러 G-Telp 분야 (2021.09.02, 온라인 주간집계 기준),YES24 국어 외국어 사전 베스트셀러 OPIC/G-TELP/ESPT외 기타 영어어학시험 분야 (2021.09.13, YES24 베스트셀러 기준),알라딘 외국어 베스트셀러 G-TELP 분야 (2021년 9월 2주, 주간 베스트 기준)
[해커스 그래머게이트웨이 베이직] 교보문고 외국어 베스트셀러 1위 (2020.11.05 인터넷일간베스트 기준)
―――――――――――――――――――――――――――――
해커스 교재 순위 (2018년 4월 13일 기준)
[토익 스타트 리딩 2016 신토익 Edition] *교보문고 토익토플 베스트셀러 (2016년 3월 16일~2016년 12월 30일, 2017년 1월 13일~2017년 4월 11일,2017년 5월 20일~2017년 7월 8일,2017년 7월 10일~2017년 7월 14일,2017년 7월 16일~2017년 8월 4일,2017년 8월 7일~2017년 9월 15일,2017년 9월 17일~2017년 9월 22일,2017년 9월 23일~2017년 9월 29일,2017년 9월 30일~2017년 10월 6일,2017년 10월 8일~2017년 10월 13일,2017년 10월 14일~2017년 10월 20일,2017년 10월 22일~2017년 10월 27일,2017년 10월 28일.2017년 10월 30일~2017년 11월 3일,2017년 11월 4일~2017년 11월 10일,2017년 11월 11일~2017년 11월 17일,2017년 11월 18일~2017년 12월 08일,2017년 12월 9일~2017년 12월 15일,2017년 12월 16일~2017년 12월 22일,2017년 12월 23일~2018년 1월 19일,2018년 1월 20일~2018년 1월 26일,2018년 1월 27일,2018년 1월 29일~2018년 2월 2일,2018년 2월 4일~2018년 2월 9일,2018년 2월 11일~2018년 2월 16일,2018년 2월 17일~2018년 3월 2일,2018년 3월 4일~2018년 3월 9일,2018년 3월 10일~2018년 3월 16일,2018년 3월 18일~2018년 3월 23일,2018년 3월 24일~2018년 3월 30일)
교보문고 외국어 베스트셀러 1위 (2016년 3월 16일 온라인 일간집계 기준)
교보문고 토익토플 베스트셀러 토익입문서 기준 1위 (2016년 3월 23일~2016년 4월 26일, 2016년 5월 18일~2016년 6월 30일, 2016년 9월 1일~2016년 12월 30일, 2017년 1월 13일~2017년 5월 23일,2017년 5월 25일, 2017년 5월 27일, 2017년 5월 29일~2017년 6월2일,2017년 9월 18일~2017년 9월 20일)
2016 베스트셀러(교보문고 2016 인터넷 베스트셀러 토익분야)
교보문고 TOEIC/TOEFL 인터넷 일간 베스트셀러 (2017.07.01 기준)
교보문고 TOEIC/TOEFL 분야 베스트셀러 1위 (2017.09.23, 인터넷 일간베스트 기준) [토익 스타트 리스닝 2016 신토익 Edition] *교보문고 토익토플 베스트셀러 (2016년 3월 16일~2017년 1월 6일, 2017년 1월 20일~2017년 2월 16일, 2017년 3월 9일~2017년 7월 8일,2017년 7월 10일~2017년 7월 14일,2017년 7월 16일~2017년 8월 4일,2017년 8월 7일~2017년 9월 15일,2017년 9월 17일~2017년 9월 22일,2017년 9월 23일~ 2017년 9월 29일,2017년 9월 30일~2017년 10월 6일,2017년 10월 8일~2017년 10월 13일,2017년 10월 14일~2017년 10월 20일,2017년 10월 22일~2017년 10월 27일,2017년 10월 28일.2017년 10월 30일~2017년 11월 3일,2017년 11월 4일~2017년 11월 10일,2017년 11월 11일~2017년 11월 17일,2017년 11월 18일~2017년 12월 08일 ,2017년 12월 9일~2017년 12월 15일,2017년 12월 16일~2017년 12월 22일,2017년 12월 23일~2018년 1월 19일,2018년 1월 20일~2018년 1월 26일,2018년 1월 27일,2018년 1월 29일~2018년 2월 2일,2018년 2월 4일~2018년 2월 9일,2018년 2월 11일~2018년 2월 16일,2018년 2월 17일~2018년 3월 2일,2018년 3월 4일~2018년 3월 9일,2018년 3월 10일~2018년 3월 16일,2018년 3월 18일~2018년 3월 23일,2018년 3월 24일~2018년 3월 30일)
교보문고 외국어 베스트셀러 1위(2016.4.4 인터넷 일간베스트 기준)
2016 베스트셀러(교보문고 2016 인터넷 베스트셀러 토익분야) [토익 중급 리딩 2016 신토익 Edition] *YES24 국어/외국어 사전 영어-토익/TOEIC 분야 베스트셀러 (2016년 4월~2018년 3월 4주)
*YES24 국어/외국어 사전 영어-토익/TOEIC 독해/문법/RC 분야 1위 (2017년 [토익 중급 리스닝 2016 신토익 Edition] *알라딘 토익 베스트셀러 (2016년 3월 4주~2017년 9월 4주, 2017년 10월 2주~2018년 1월 1주,2018년 1월 4주~2018년 3월 4주) [해커스 토익 Reading (2018 최신개정판)] *교보문고 토익토플 베스트셀러 (2017년 12월 8일,2017년 12월 9일~2017년 12월 15일,2017년 12월 16일~2017년 12월 22일,2017년 12월 23일~2018년 1월 5일,2018년 1월 13일~2018년 1월 19일,2018년 1월 20일~2018년 1월 26일,2018년 1월 27일,2018년 1월 29일~2018년 2월 2일,2018년 2월 4일~2018년 2월 9일,2018년 2월 11일~2018년 2월 16일,2018년 2월 17일~2018년 3월 2일,2018년 3월 4일~2018년 3월 9일,2018년 3월 10일~2018년 3월 16일,2018년 3월 18일~2018년 3월 23일,2018년 3월 24일~2018년 3월 30일)
*교보문고 외국어 베스트셀러 수험영어 토익 분야 1위 (2017년 12월 11일~2017년 12월 12일,2017년 12월 22일,2017년 12월 26일~2017년 12월 29일,2018년 1월 29일~2018년 2월 2일,2018년 2월 5일~2018년 2월 9일,2018년 2월 12일~2018년 2월 14일,2018년 2월 19일~2018년 2월 23일,2018년 2월 26일~2018년 2월 28일,2018년 3월 2일,2018년 3월 6일~2018년 3월 9일,2018년 3월 12일~2018년 3월 16일,2018년 3월 19일~2018년 3월 20일,2018년 3월 22일~2018년 3월 23일,2018년 3월 26일~2018년 3월 28일,2018년 3월 30일 온라인 주간 베스트 기준)
교보문고 토익토플 베스트셀러 1위 (2017년 12월 9일~2017년 12월 10일,2017년 12월 23일~2017년 12월 25일,2018년 1월 20일~2018년 1월 26일,2018년 1월 27일,2018년 2월 11일,2018년 2월 15일~2018년 2월 16일,2018년 2월 17일~2018년 2월 18일,2018년 3월 4일~2018년 3월 9일,2018년 3월 10일~2018년 3월 11일,2018년 3월 18일,2018년 3월 24일~2018년 3월 25일)
교보문고 TOEIC/TOEFL 베스트셀러 1위 (2017. 12. 19, 인터넷 일간베스트 기준)
교보문고 TOEIC/TOEFL 베스트셀러 1위 (2018.2.7 인터넷 주간베스트 기준) [해커스 토익 Listening (2018 최신개정판)] *교보문고 토익토플 베스트셀러 (2017년 12월 8일,2017년 12월 9일~2017년 12월 15일,2017년 12월 16일~2017년 12월 22일,2017년 12월 23일~2018년 1월 5일,2018년 1월 13일~2018년 1월 19일,2018년 1월 20일~2018년 1월 26일,2018년 1월 27일,2018년 1월 29일~2018년 2월 2일,2018년 2월 4일~2018년 2월 9일,2018년 2월 11일~2018년 2월 16일,2018년 2월 17일~2018년 3월 2일,2018년 3월 4일~2018년 3월 9일,2018년 3월 10일~2018년 3월 16일,2018년 3월 18일~2018년 3월 23일,2018년 3월 24일~2018년 3월 30일)
교보문고 TOEIC/TOEFL 베스트셀러 LC 기준 1위 (2017. 12. 20, 인터넷 일간베스트 기준) [토익 실전 1000제 1 리딩 문제집 2016 신토익 Edition] *YES24 국어/외국어 사전 영어-토익/TOEIC 분야 베스트셀러 (2016년 6월~2018년 3월 4주)
*YES24 국어/외국어 사전 토익/TOEIC 독해/문법/RC 분야 1위 (2017년 8월 3주~2017년 12월 1주)
YES24 국어 외국어 사전 베스트셀러 청해/LC분야 1위 (2017년 9월 3주, 주별 베스트 기준)
YES24 국어 외국어 사전 베스트셀러 1위 (2016년 10월~2017년 2월 월별 베스트 기준)
YES24 국어 외국어 사전 토익/TOEIC 베스트셀러 1위 (2017년 4월 24일, YES24 베스트셀러 기준)
YES24 국어외국어사전 베스트셀러 토익/TOEIC 분야 (2017.06.09, YES24베스트셀러)
YES24 국어 외국어 사전 베스트셀러 1위 (2017.08.02, 일별베스트 기준)
YES24 국어 외국어 사전 부문 독해/문법/RC 분야 베스트셀러 1위 (2017. 11 월별베스트 기준)
YES24 국어 외국어 사전 베스트셀러 독해/문법/RC 분야 1위 (2017년 12월 1주 주별베스트) [토익 실전 1000제 1 리딩 해설집 2016 신토익 Edition] *YES24 국어/외국어 사전 영어-토익/TOEIC 분야 베스트셀러 (2016년 6월~2018년 3월 4주)
*YES24 국어/외국어 사전 토익/TOEIC 독해/문법/RC 분야 1위 (2017년 8월 3주~2017년 12월 1주)
YES24 국어 외국어 사전 베스트셀러 청해/LC분야 1위 (2017년 9월 3주, 주별 베스트 기준)
YES24 국어 외국어 사전 베스트셀러 1위 (2016년 10월~2017년 2월 월별 베스트 기준)
YES24 국어 [토익 실전 1000제 1 리스닝 문제집 2016 신토익 Edition] *YES24 국어/외국어 사전 영어-토익/TOEIC 분야 베스트셀러 (2016년 6월~2016년 7월, 2016년 9월~2018년 3월 4주)
*YES24 국어/외국어사전 영어-토익/TOEIC 청해/LC 분야 1위 (2017년 8월 3주~2017년 9월 2주,2017년 10월 2주~2017년 12월 1주)
YES24 국어외국어사전 베스트셀러 1위 (2016.10.24 일별베스트 기준)
Yes24 베스트셀러 국어외국어사전 청해/LC 월별베스트 1위 (2017년 2월 기준)
YES24 국어외국어사전 베스트셀러 청해/LC 분야 (2017.06.09, YES24베스트셀러)
YES24 국어 외국어 사전 부문 청해/LC 분야 베스트셀러 1위 (2017. 11 월별베스트 기준)
YES24 국어 외국어 사전 베스트셀러 청해/LC 분야 1위 (2017년 12월 1주 주별베스트) [토익 실전 1000제 1 리스닝 해설집 2016 신토익 Edition] *교보문고 토익토플 베스트셀러(2017년 5월 15일~2017년7월 8일,2017년 7월 10일~2017년 7월 14일,2017년 7월 16일~2017년 8월 4일,2017년 8월 7일~2017년 9월 15일,2017년 9월 17일~2017년 9월 22일,2017년 9월 23일~ 2017년 9월 29일,2017년 9월 30일~2017년 10월 6일,2017년 10월 8일~2017년 10월 13일,2017년 10월 14일~2017년 10월 20일,2017년 10월 22일~2017년 10월 27일,2017년 10월 28일.2017년 10월 30일~2017년 11월 3일,2017년 11월 4일~2017년 11월 10일,2017년 11월 11일~2017년 11월 17일,2017년 11월 18일~2017년 12월 08일,2017년 12월 9일~2017년 12월 15일,2017년 12월 16일~2017년 12월 22일,2017년 12월 23일~2018년 1월 19일,2018년 1월 20일~2018년 1월 26일,2018년 1월 27일,2018년 1월 29일~2018년 2월 2일,2018년 2월 4일~2018년 2월 9일,2018년 2월 11일~2018년 2월 16일,2018년 2월 17일~2018년 3월 2일,2018년 3월 4일~2018년 3월 9일,2018년 3월 10일~2018년 3월 16일,2018년 3월 18일~2018년 3월 23일,2018년 3월 24일~2018년 3월 30일)
2016 베스트셀러(교보문고 2016 인터넷 베스트셀러 토익분야) [해커스 신토익 실전 1000제 2 리딩 문제집] *교보문고 토익토플 베스트셀러(2017년 5월 15일~2017년 7월 8일,2017년 7월 10일~2017년 7월 14일,2017년 7월 16일~2017년 8월 4일,2017년 8월 7일~2017년 9월 15일,2017년 9월 17일~2017년 9월 22일,2017년 9월 23일~ 2017년 9월 29일,2017년 9월 30일~2017년 10월 6일,2017년 10월 8일~2017년 10월 13일,2017년 10월 14일~2017년 10월 20일,2017년 10월 22일~2017년 10월 27일,2017년 10월 28일.2017년 10월 30일~2017년 11월 3일,2017년 11월 4일~2017년 11월 10일,2017년 11월 11일~2017년 11월 17일,2017년 11월 18일~2017년 12월 08일,2017년 12월 9일~2017년 12월 15일,2017년 12월 16일~2017년 12월 22일,2017년 12월 23일~2018년 1월 19일,2018년 1월 20일~2018년 1월 26일,2018년 1월 27일,2018년 1월 29일~2018년 2월 2일,2018년 2월 4일~2018년 2월 9일,2018년 2월 11일~2018년 2월 16일,2018년 2월 17일~2018년 3월 2일,2018년 3월 4일~2018년 3월 9일,2018년 3월 10일~2018년 3월 16일,2018년 3월 18일~2018년 3월 23일,2018년 3월 24일~2018년 3월 30일)
교보문고 TOEIC/TOEFL 베스트셀러 (2016.7.25 일간베스트 기준) 2016 베스트셀러(교보문고 2016 인터넷 베스트셀러 토익분야) [해커스 신토익 실전 1000제 2 리딩 해설집] *알라딘 토익 베스트셀러 (2016년 8월 4주~2017년 9월 4주, 2017년 10월 2주~2018년 3월 4주) [해커스 신토익 실전 1000제 2 리스닝 문제집] *YES24 국어/외국어 사전 영어-토익/TOEIC 분야 베스트셀러 (2016년 9월~2017년 6월 2주,2017년 6월 4주~2018년 3월 4주)
YES24 국어외국어사전 베스트셀러 토익 기출문제/모의고사 분야 1위 (2016년 8월 1주, 2017년 10월 2주 주별베스트)
YES24 국어 외국어 사전 베스트셀러 기출문제/모의고사분야 1위 (2017년 10월 2주 주별베스트) [해커스 신토익 실전 1000제 2 리스닝 해설집] *YES24 국어/외국어 사전 영어-토익/TOEIC 분야 베스트셀러 (2016년 9월~2018년 3월 4주) [해커스 신토익 실전 1000제 3 리딩 문제집] *교보문고 토익토플 베스트셀러(2017년 5월 15~2017년 7월 8일,2017년 7월 10일~2017년 7월 14일,2017년 7월 16일~2017년 8월 4일,2017년 8월 7일~2017년 9월 15일,2017년 9월 17일~2017년 9월 22일,2017년 9월 23일~ 2017년 9월 29일,2017년 9월 30일~2017년 10월 6일,2017년 10월 8일~2017년 10월 13일,2017년 10월 14일~2017년 10월 20일,2017년 10월 22일~2017년 10월 27일,2017년 10월 28일.2017년 10월 30일~2017년 11월 3일,2017년 11월 4일~2017년 11월 10일,2017년 11월 11일~2017년 11월 17일,2017년 11월 18일~2017년 12월 08일,2017년 12월 9일~2017년 12월 15일,2017년 12월 16일~2017년 12월 22일,2017년 12월 23일~2018년 1월 19일,2018년 1월 20일~2018년 1월 26일,2018년 1월 27일,2018년 1월 29일~2018년 2월 2일,2018년 2월 4일~2018년 2월 9일,2018년 2월 11일~2018년 2월 16일,2018년 2월 17일~2018년 3월 2일,2018년 3월 4일~2018년 3월 9일,2018년 3월 10일~2018년 3월 16일,2018년 3월 18일~2018년 3월 23일,2018년 3월 24일~2018년 3월 30일 ) [해커스 신토익 실전 1000제 3 리딩 해설집] *알라딘 토익 베스트셀러 (2017년 1월 3주~2017년 9월 4주, 2017년 10월 2주~2018년 3월 4주) [해커스 신토익 실전 1000제 3 리스닝 문제집] *교보문고 토익토플 베스트셀러(2017년 5월 15~2017년 7월 8일,2017년 7월 10일~2017년 7월 14일,2017년 7월 16일~2017년 8월 4일,2017년 8월 7일~2017년 9월 15일,2017년 9월 17일~2017년 9월 22일,2017년 9월 23일~ 2017년 9월 29일,2017년 9월 30일~2017년 10월 6일,2017년 10월 8일~2017년 10월 13일,2017년 10월 14일~2017년 10월 20일,2017년 10월 22일~2017년 10월 27일,2017년 10월 28일.2017년 10월 30일~2017년 11월 3일,2017년 11월 4일~2017년 11월 10일,2017년 11월 11일~2017년 11월 17일,2017년 11월 18일~2017년 12월 08일,2017년 12월 9일~2017년 12월 15일,2017년 12월 16일~2017년 12월 22일,2017년 12월 23일~2018년 1월 19일,2018년 1월 20일~2018년 1월 26일,2018년 1월 27일,2018년 1월 29일~2018년 2월 2일,2018년 2월 4일~2018년 2월 9일,2018년 2월 11일~2018년 2월 16일,2018년 2월 17일~2018년 3월 2일,2018년 3월 4일~2018년 3월 9일,2018년 3월 10일~2018년 3월 16일,2018년 3월 18일~2018년 3월 23일,2018년 3월 24일~2018년 3월 30일 )
[해커스 신토익 실전 1000제 3 리스닝 해설집] *YES24 국어/외국어 사전 영어-토익/TOEIC 분야 베스트셀러 (2017년 2월~2017년 12월 4주.2018년 1월 3주~2018년 3월 4주)
Yes24 국어외국어사전 토익 기출문제/모의고사 분야 (2017.01.05, YES24 베스트셀러) Yes24 국어외국어사전 베스트셀러 토익 기출문제/모의고사 분야 (2017.1.19 Yes24 베스트셀러 기준)
[해커스 토익 보카(2016 신토익 Edition)] *교보문고 토익토플 베스트셀러 (2016년 5월 11일~2017년 7월 8일,2017년 7월 10일~2017년 7월 14일,2017년 7월 16일~2017년 8월 4일,2017년 8월 7일~2017년 9월 15일,2017년 9월 17일~2017년 9월 22일,2017년 9월 23일~ 2017년 9월 29일,2017년 9월 30일~2017년 10월 6일,2017년 10월 8일~2017년 10월 13일,2017년 10월 14일~2017년 10월 20일,2017년 10월 22일~2017년 10월 27일,2017년 10월 28일.2017년 10월 30일~2017년 11월 3일,2017년 11월 4일~2017년 11월 10일,2017년 11월 11일~2017년 11월 17일,2017년 11월 18일~2017년 12월 08일,2017년 12월 9일~2017년 12월 15일,2017년 12월 16일~2017년 12월 22일,2017년 12월 23일~2018년 1월 5일,2018년 1월 13일~2018년 1월 19일,2018년 1월 20일~2018년 1월 26일,2018년 1월 27일,2018년 1월 29일~2018년 2월 2일,2018년 2월 4일~2018년 2월 9일,2018년 2월 11일~2018년 2월 16일,2018년 2월 17일~2018년 3월 2일,2018년 3월 4일~2018년 3월 9일,2018년 3월 10일~2018년 3월 16일,2018년 3월 18일~2018년 3월 23일,2018년 3월 24일~2018년 3월 30일 )
교보문고 외국어 베스트셀러 수험영어 토익 분야 1위 (2017년 8월 29일~2017년 9월 1일, 2017년 9월 4일~2017년 9월 8일, 2017년 9월 11일~9월 15일,2017년 9월 25일~2017년 9월 29일,2017년 10월 10일 온라인 주간 베스트 기준)
교보문고 토익토플 베스트셀러 토익보카 기준 1위 (2016년 5월 18일~2017년 5월 25일, 2017년 5월 27일, 2017년 5월 29일~2017년 6월 2일,2017년 9월 21일~2017년 9월 22일)
교보문고 TOEIC/TOEFL 베스트셀러 1위 (2016.8.27~28 인터넷 일간베스트 기준) 교보문고 종합 월간 베스트셀러 토익/토플분야 1위 (2017년 5월 월간 기준) 교보문고 외국어 베스트셀러 1위(2016.5.29 인터넷 일간베스트 기준) 2016 베스트셀러(교보문고 2016 인터넷 베스트셀러 토익분야) 베스트셀러 1위(교보문고 종합 월간 베스트셀러 토익/토플분야 1위 (2017년 4월 월간 기준) 12년 연속 베스트셀러 1위(교보문고 토익토플 베스트셀러 토익보카 기준 1위(2006~2016 연간베스트, 2017년 1~5월 월간베스트 기준))
교보문고 TOEIC/TOEFL 분야 베스트셀러 1위 (2017.07.31, 온라인 일간집계 기준)
교보문고 주간 베스트셀러 토익/토플분야 1위 (2017년 8월 5주차 기준)
교보문고 종합 베스트셀러 토익/토플분야 1위 (2018년 1월 월간베스트 기준)
교보문고 종합 베스트셀러 토익/토플분야 토익보카 기준 1위(2006년~2017 연간, 2018년 1월 월간) [한 권으로 끝내는 해커스 신토익 700+ (LC+ RC)] *YES24 국어/외국어 사전 영어-토익/TOEIC 분야 베스트셀러 (2016년 10월~2017년 5월 1주, 2017년 5월 3주~2018년 3월 4주)
Yes24 국어 외국어 사전 베스트셀러 (2016.10.11, 일별 베스트 기준)
Yes24 토익/TOEIC 베스트셀러 (2016.10.11, 주간집계 기준) [스타토익 필수문법 공식 Part 5&6 (신토익 Edition)] *YES24 국어/외국어 사전 영어-토익/TOEIC 분야 베스트셀러 (2016년 9월~2018년 3월 4주) [한 권으로 끝내는 해커스 토익 실전 LC+RC (모의고사+해설집)] *교보문고 토익토플 베스트셀러(2017년 6월 2일, 2017년 6월 4일~2017년 7월 8일,2017년 7월 10일~2017년 7월 14일,2017년 7월 16일~2017년 8월 4일,2017년 8월 7일~2017년 9월 15일,2017년 9월 17일~2017년 9월 22일,2017년 9월 23일~ 2017년 9월 29일,2017년 9월 30일~2017년 10월 6일,2017년 10월 8일~2017년 10월 13일,2017년 10월 14일~2017년 10월 20일,2017년 10월 22일~2017년 10월 27일,2017년 10월 28일.2017년 10월 30일~2017년 11월 3일,2017년 11월 4일~2017년 11월 10일,2017년 11월 11일~2017년 11월 17일,2017년 11월 18일~2017년 12월 08일,2017년 12월 9일~2017년 12월 15일,2017년 12월 16일~2017년 12월 22일,2017년 12월 23일~2018년 1월 19일,2018년 1월 20일~2018년 1월 26일,2018년 1월 27일,2018년 1월 29일~2018년 2월 2일,2018년 2월 4일~2018년 2월 9일,2018년 2월 11일~2018년 2월 16일,2018년 2월 17일~2018년 3월 2일,2018년 3월 4일~2018년 3월 9일,2018년 3월 10일~2018년 3월 16일,2018년 3월 18일~2018년 3월 23일,2018년 3월 24일~2018년 3월 30일)
교보문고 토익토플 인터넷 일간 베스트셀러 (2017.06.08 기준)
[해커스 토익 Part 7 집중공략 777] *교보문고 토익토플 베스트셀러(2017년 7월 29일~2017년 8월 4일,2017년 8월 7일~2017년 9월 15일,2017년 9월 17일~2017년 9월 22일,2017년 9월 23일~ 2017년 9월 29일,2017년 9월 30일~2017년 10월 6일,2017년 10월 8일~2017년 10월 13일,2017년 10월 14일~2017년 10월 20일,2017년 10월 22일~2017년 10월 27일,2017년 10월 28일.2017년 10월 30일~2017년 11월 3일,2017년 11월 4일~2017년 11월 10일,2017년 11월 11일~2017년 11월 17일,2017년 11월 18일~2017년 12월 08일,2017년 12월 9일~2017년 12월 15일,2017년 12월 16일~2017년 12월 22일,2017년 12월 23일~2018년 1월 19일,2018년 1월 20일~2018년 1월 26일,2018년 1월 27일,2018년 1월 29일~2018년 2월 2일,2018년 2월 4일~2018년 2월 9일,2018년 2월 11일~2018년 2월 16일,2018년 2월 17일~2018년 3월 2일,2018년 3월 4일~2018년 3월 9일,2018년 3월 10일~2018년 3월 16일,2018년 3월 18일~2018년 3월 23일,2018년 3월 24일~2018년 3월 30일) [해커스 토익 리딩(초판~4판) 교보문고 토익토플 베스트셀러 토익리딩 기준 1위 (2005년~2015년 6월 9일) [해커스 토익 리스닝(초판~4판) 교보문고 토익토플 베스트셀러 토익리스닝 기준 1위 (2005년~2015년 6월 9일)
[해커스 토익 스타트 리딩 YES24 토익 베스트셀러 (2008년~2017년 1월) [해커스 토익 스타트 리스닝] YES24 토익 베스트셀러 (2008년 11월~2017년 1월) [해커스 토익 중급 리딩 YES24 토익 베스트셀러 (2009년 11월~2014년 12월 4주, 2015년 1월~2017년 1월) [해커스 토익 중급 리스닝] YES24 토익 베스트셀러 (2013년 10월~2017년 1월) [해커스 토익 실전 1000제 리딩 2] 알라딘 토익 베스트셀러 (2010년~2015년 3월 5주, 2016년 8월 1주) [해커스 토익 실전 1000제 리스닝 2] 알라딘 외국어 베스트셀러 1위 (2015.4.12 어제베스트 기준) 알라딘 토익 베스트셀러 (2010년~2015년 3월 5주) [해커스 토익 실전 1000제 리딩 2 (전면개정판)] YES24 토익 베스트셀러 (2015년 5월~2016년 9월) YES24 국어와 외국어사전 베스트셀러 토익 RC기준 1위 (2015.05.11 일간베스트 기준) [해커스 토익 실전 1000제 리딩 2 해설집(전면개정판)] YES24 국어와 외국어사전 베스트셀러 (2015.05.11 일간베스트 기준) YES24 토익 베스트셀러 (2015년 7월, 2015년 9월~2016년 8월) [해커스 토익 실전 1000제 리스닝 2(전면개정판)] YES24 토익 베스트셀러 (2015년 5월~2015년 7월, 2015년 12월~2016년 8월) YES24 국어와 외국어사전 베스트셀러 토익 LC기준 1위 (2015.05.11 일간베스트 기준) [해커스 토익 실전 1000제 리스닝 2 해설집(전면개정판)] YES24 토익 베스트셀러 (2015년 7월, 2015년 9월~2016년 8월) [해커스 토익 실전 1000제 리딩 3 문제집(2016)] 교보문고 외국어 베스트셀러 1위(2016.02.02, 인터넷 일간 베스트 기준) [해커스 토익 실전 1000제 리딩 3 해설집 (2016)] YES24 토익 베스트셀러 (2016년 1월~2016년 5월, 2016년 8월~2016년 9월) [해커스 토익 실전 1000제 리스닝 3 문제집(2016)] 알라딘 외국어 신간 베스트셀러 토익 분야 1위 (2015.12.17 기준) 알라딘 토익 베스트셀러 (2015년 12월 2주~2016년 9월 3주, 2016년 10월 1주~2016년 10월 3주, 2016년 11월 2주) 알라딘 토익 베스트셀러 토익 실전거 시준 1위 (2016년 2월 5주) [해커스 토익 실전 1000제 리스닝 3 해설집 (2016)] 알라딘 토익 베스트셀러 (2015년 12월 2주~2016년 5월 2주, 2016년 5월 4주~2016년 6월 2주, 2016년 7월 1주~2016년 7월 4주, 2016년 8월 2주~2016년 8월 4주, 2016년 9월 1주~2016년 9월 3주, 2016년 10월 1주~2016년 10월 3주, 2016년 12월 1주) [해커스 토익 실전 예상강의 파트 5&6] YES24 토익 베스트셀러 (2013년 5월~2014년 12월 4주, 2015년 1월~2016년 2월) [해커스 토익 실전 예상강의 파트 5&6 (2)] YES24 토익 베스트셀러 (2014년 1월~2015년 7월, 2015년 9월~2016년 2월) [스타토익 필수 문법 공식 Part5 & 6 YES24 토익 베스트셀러 (2015년 8월~2016년 5월) [해커스 토익 Reading 2015 최신개정판 교보문고 토익토플 베스트셀러 토익리딩 기준 1위 (2015년 6월 10일~2016년 3월 15일, 2016년 3월 23일~ 2016년 4월 5일) 교보문고 외국어 베스트셀러 1위 (2015.06.14 일간베스트 기준, 2015년 7월 8일 ~ 2015년 7월 14일, 2015년 8월 4일~2015년 8월 11일) [해커스 토익 Listening 2015 최신개정판 알라딘 토익 베스트셀러 토익리스닝 기준 1위(2015년 7월 1주~2016년 1월 2주, 2016년 2월 3주~2016년 3월 3주) 알라딘 토익 베스트셀러 (2015년 6월 3주~2016년 5월 5주, 2016년 7월 1주~2016년 7월 4주) [해커스 토익 실전 Listening YES24 토익 베스트셀러 (2014년 7월~2017년 1월) [해커스 토익 실전 Reading YES24 토익 베스트셀러 (2014년 7월~2017년 1월) [토익 실전 1000제 1 리딩 문제집 개정판] YES24 토익 베스트셀러 (2010년 4월~2016년 9월) [토익 실전 1000제 1 리스닝 문제집 개정판] YES24 토익 베스트셀러 (2013년 9월~2016년 9월) YES24 국어 외국어 사전 청해/LC 베스트셀러 1위 (2017년 4월 24일, YES24 베스트셀러 기준) [스타토익 베이직 YES24 토익 베스트셀러 (2013년 9월~2016년 4월) [스타토익 파트 5&6 실전] YES24 토익 베스트셀러 (2009년 8월~2014년 8월 4주, 2014년 12월, 2015년 6월, 2015년 9월) [해커스 토익 Reading 2016 신토익 Edition] *교보문고 토익토플 베스트셀러 (2016년 3월 16일~2017년 7월 8일,2017년 7월 10일~2017년 7월 14일,2017년 7월 16일~2017년 8월 4일,2017년 8월 7일~2017년 9월 15일,2017년 9월 17일~2017년 9월 22일,2017년 9월 23일~ 2017년 9월 29일,2017년 9월 30일~2017년 10월 6일,2017년 10월 8일~2017년 10월 13일,2017년 10월 14일~2017년 10월 20일,2017년 10월 22일~2017년 10월 27일,2017년 10월 28일.2017년 10월 30일~2017년 11월 3일,2017년 11월 4일~2017년 11월 10일,2017년 11월 11일~2017년 11월 17일,2017년 11월 18일~2017년 12월 08일,2017년 12월 9일~2017년 12월 15일 ) *교보문고 외국어 베스트셀러 수험영어 토익 분야 1위 (2017년 10월 11일~2017년 10월 13일,2017년 10월 16일~2017년 10월 20일,2017년 10월 23일~2017년 10월 27일.2017년 10월 30일~2017년 11월 3일,2017년 11월 6일~2017년 11월 10,2017년 11월 13일~2017년 11월 17일,2017년 11월 20일~2017년 11월 24일 온라인 주간 베스트 기준)
교보문고 외국어 베스트셀러 1위 (2016.03.22 인터넷 일간 베스트 / 출간일 2016.03.21) 교보문고 토익토플 베스트셀러 1위 (2016년 5월 11일~2016년 5월 31일,2017년 10월 14일~2017년 10월 15일,2017년 10월 28일,2017년 11월 4일~2017년 11월 5일,2017년 11월 11일~2017년 11월 12일,2017년 11월 18일~2017년 11월 19일)
교보문고 토익토플 베스트셀러 토익리딩 기준 1위 (2016년 5월 25일~2016년 6월 30일, 2016년 9월 1일~2017년 5월 25일)
2016 베스트셀러(교보문고 2016 인터넷 베스트셀러 토익분야)
교보문고 TOEIC/TOEFL 베스트셀러 1위(2017.04.24, 인터넷주간베스트 기준) 교보문고 TOEIC/TOEFL 베스트셀러 1위 (2017년 4월 26일, 온라인 주간 집계 기준) [해커스 토익 Listening 2016 신토익 Edition] *교보문고 토익토플 베스트셀러 (2016년 3월 23일~~2017년 7월 8일,2017년 7월 10일~2017년 7월 14일,2017년 7월 16일~2017년 8월 4일,2017년 8월 7일~2017년 9월 15일,2017년 9월 17일~2017년 9월 22일,2017년 9월 23일~ 2017년 9월 29일,2017년 9월 30일~2017년 10월 6일,2017년 10월 8일~2017년 10월 13일,2017년 10월 14일~2017년 10월 20일,2017년 10월 22일~2017년 10월 27일,2017년 10월 28일.2017년 10월 30일~2017년 11월 3일,2017년 11월 4일~2017년 11월 10일,2017년 11월 11일~2017년 11월 17일,2017년 11월 18일~2017년 12월 08일 ,2017년 12월 9일~2017년 12월 15일)
교보문고 토익토플 베스트셀러 토익리스닝 기준 1위 (2016년 5월 18일~2016년 6월 30일, 2016년 9월 1일~2017년 5월 25일) 2016 베스트셀러(교보문고 2016 인터넷 베스트셀러 토익분야) 교보문고 TOEIC/TOEFL 베스트셀러 1위 (2017년 4월 26일, 온라인 일간 집계 기준)
[텝스 베이직 리딩] *교보문고 토익토플 베스트셀러(2017년 5월 29일~2017년 6월 13일,2017년 6월 17일~2017년 7월 8일,2017년 7월 10일~2017년 7월 14일,2017년 7월 16일~2017년 8월 4일,2017년 8월 7일 ~2017년 8월 11일,2017년 8월 14일~2017년 8월 31일,2017년 9월 2일 ~2017년 9월 15일,2017년 9월 17일~2017년 9월 22일,2017년 9월 23일~2017년 9월 27일,2017년 10월 6일,2017년 10월 8일~2017년 10월 13일,2017년 10월 14일~2017년 10월 20일,2017년 10월 22일~2017년 10월 27일,2017년 10월 28일.2017년 10월 30일~2017년 11월 3일,2017년 11월 4일~2017년 11월 10일,2017년 11월 11일~2017년 11월 17일,2017년 11월 18일~2017년 11월 20일,2017년 11월 24일~2017년 12월 08일,2017년 12월 09일,2017년 12월 12일~2017년 12월 15일,2017년 12월 16일~2017년 12월 22일,2017년 12월 23일~2018년 1월 19일,2018년 1월 20일~2018년 1월 26일,2018년 1월 27일,2018년 1월 29일~2018년 2월 2일,2018년 2월 4일~2018년 2월 9일,2018년 2월 11일~2018년 2월 16일,2018년 2월 17일~2018년 3월 2일,2018년 3월 4일~2018년 3월 9일,2018년 3월 10일~2018년 3월 16일,2018년 3월 18일~2018년 3월 23일,2018년 3월 24일~2018년 3월 30일 ) *교보문고 외국어 베스트셀러 (2017년 12월 05일~2017년 12월 08일) [텝스 베이직 리스닝] *알라딘 텝스 베스트셀러 (2010년~2014년 12월 2주, 2015년 1월 2주~2015년 6월 2주, 2015년 6월 5주~2015년 9월 3주, 2015년 9월 5주~2016년 11월 1주, 2016년 11월 3주~2017년 3월 3주, 2017년 4월 1주~2017년 8월 4주,2017년 9월 2주~2017년 9월 4주, 2017년 10월 2주~2017년 10월 4주, 2017년 11월 2주~2018년 1월 1주,2018년 1월 3주~2018년 3월 4주)
알라딘 외국어베스트셀러 텝스 분야 (2008~2016 역대베스트 기준) [텝스 Reading (개정판)] *교보문고 토익토플 베스트셀러(2017년 5월 29일~~2017년 7월8일,2017년 7월 10일~2017년 7월 14일,2017년 7월 16일~2017년 8월 4일,2017년 8월 7일 ~2017년 9월 15일,2017년 9월 17일~2017년 9월 22일,2017년 9월 23일~2017년 9월 29일,2017년 9월 30일~2017년 10월 6일,2017년 10월 8일~2017년 10월 13일,2017년 10월 14일~2017년 10월 20일,2017년 10월 22일~2017년 10월 27일,2017년 10월 28일.2017년 10월 30일~2017년 11월 3일,2017년 11월 4일~2017년 11월 10일,2017년 11월 11일~2017년 11월 17일,2017년 11월 18일~2017년 12월 08일,2017년 12월 9일~2017년 12월 15일,2017년 12월 16일~2017년 12월 22일,2017년 12월 23일~2018년 1월 19일,2018년 1월 20일~2018년 1월 26일,2018년 1월 27일,2018년 1월 29일~2018년 2월 2일,2018년 2월 4일~2018년 2월 9일,2018년 2월 11일~2018년 2월 16일,2018년 2월 17일~2018년 3월 2일,2018년 3월 4일~2018년 3월 9일,2018년 3월 10일~2018년 3월 16일,2018년 3월 18일~2018년 3월 23일,2018년 3월 24일~2018년 3월 30일)
교보문고 외국어 베스트셀러 텝스 리딩 기준 1위 ( 2015년 6월 10일~2015년 6월 30일, 2015년 7월 21일~2016년 4월 5일, 2016년 5월 4일~2016년 8월 3일, 2016년 9월 8일, 2017년 1월 26일~2017년 2월 10일) 교보문고 외국어 베스트셀러(2015년 6월 10일~2016년 4월 5일, 2016년 5월 11일~2016년 8월 3일, 2016년 9월 8일, 2016년 12월 23일, 2017년 1월 6일~2017년 2월 10일, 2017년 3월 9일)
[텝스 Listening (개정판)] *교보문고 토익토플 베스트셀러(2017년 5월 29일~2017년 7월 8일,2017년 7월 10일~2017년 7월 14일,2017년 7월 16일~2017년 8월 4일,2017년 8월 7일 ~2017년 9월 15일,2017년 9월 17일~2017년 9월 22일,2017년 9월 23일~2017년 9월 29일,2017년 9월 30일~2017년 10월 6일,2017년 10월 8일~2017년 10월 13일,2017년 10월 14일~2017년 10월 20일,2017년 10월 22일~2017년 10월 27일,2017년 10월 28일.2017년 10월 30일~2017년 11월 3일,2017년 11월 4일~2017년 11월 10일,2017년 11월 11일~2017년 11월 17일,2017년 11월 18일~2017년 12월 08일,2017년 12월 9일~2017년 12월 15일,2017년 12월 16일~2017년 12월 22일,2017년 12월 23일~2018년 1월 19일,2018년 1월 20일~2018년 1월 26일,2018년 1월 27일,2018년 1월 29일~2018년 2월 2일,2018년 2월 4일~2018년 2월 9일,2018년 2월 11일~2018년 2월 16일,2018년 2월 17일~2018년 3월 2일,2018년 3월 4일~2018년 3월 9일,2018년 3월 10일~2018년 3월 16일,2018년 3월 18일~2018년 3월 23일,2018년 3월 24일~2018년 3월 30일)
교보문고 외국어 베스트셀러 ( 2015년 6월 17일~2015년 8월 11일, 2015년 9월 8일~2015년 9월 15일, 2015년 12월 23일~2016년 3월 15일, 2016년 7월 12일, 2017년 1월 6일~2017년 1월 13일)
교보문고 외국어 베스트셀러 텝스 리스닝 기준 1위 ( 2015년 6월 17일~2015년 6월 30일, 2015년 7월 21일~2015년 7월 28일, 2015년 9월 8일~2015년 9월 15일, 2015년 12월 23일~2016년 2월 16일, 2016년 2월 24일~2016년 3월 15일, 2016년 7월 12일, 2017년 1월 6일~2017년 1월 13일)
2016 베스트셀러(교보문고 2016 인터넷 베스트셀러 외국어분야)
[텝스 최신기출유형 실전 1200제 문제집] *알라딘 텝스 베스트셀러 (2015년 12월 2주~2016년 6월 2주,2016년 7월 2주~2016년 12월 4주,2017년 1월 2주~2017년 9월 4주,2017년 10월 2주~2018년 3월 4주)
*알라딘 텝스 실전 분야 1위 (2016년 1월 2주~2016년 1월 4주, 2016년 2월 2주, 2016년 2월 4주, 2016년 3월 5주, 2016년 7월 3주, 2016년 9월 2주, 2017년 6월 2주, 2017년 8월 3주~2017년 9월 4주, 2017년 10월 2주~2017년 10월 3주, 2017년 11월 1주~2017년 12월 2주,2017년 12월 4주~2018년 3월 2주)
알라딘 외국어 베스트셀러 텝스 기준 1위 (2015년 12월 20일 어제베스트 기준)
알라딘 외국어 신간 베스트셀러 텝스 분야 1위 (2015.12.17 기준)
알라딘 외국어 베스트셀러 텝스 실전 분야 1위 (2015.12~2017.4, 월별 베스트셀러)
알라딘 외국어 베스트셀러 텝스 실전 분야 1위 (2015.12~2017.08 온라인 월간집계 기준)
알라딘 외국어베스트셀러 텝스 분야 (2008~2016 역대베스트 기준) [텝스 최신기출유형 실전 1200제 해설집] *교보문고 토익토플 베스트셀러(2017년 5월 29일~2017년 7월 5일,2017년7월 8일,2017년 7월 10일 ~ 2017년 7월 14일,2017년 7월 16일~2017년 8월 4일,2017년 8월 7일 ~2017년 9월 15일,2017년 9월 17일~2017년 9월 22일,2017년 9월 23일~2017년 9월 29일,2017년 9월 30일~2017년 10월 6일,2017년 10월 8일~2017년 10월 13일,2017년 10월 14일~2017년 10월 20일,2017년 10월 27일,2017년 10월 28일.2017년 10월 30일~2017년 11월 3일,2017년 11월 4일~2017년 11월 10일,2017년 11월 11일~2017년 11월 17일,2017년 11월 18일~2017년 12월 08일,2017년 12월 9일~2017년 12월 15일,2017년 12월 16일~2017년 12월 20일,2017년 12월 22일,2017년 12월 23일~2018년 1월 19일,2018년 1월 20일~2018년 1월 26일,2018년 1월 27일,2018년 1월 29일~2018년 2월 2일,2018년 2월 4일~2018년 2월 9일,2018년 2월 11일~2018년 2월 16일,2018년 2월 22일,2018년 2월 24일~2018년 3월 2일,2018년 3월 4일~2018년 3월 9일,2018년 3월 10일~2018년 3월 16일,2018년 3월 18일~2018년 3월 23일,2018년 3월 24일~2018년 3월 30일)
교보문고 외국어 베스트셀러 (2015.12.16 인터넷주간베스트 기준) *알라딘 텝스 베스트셀러 (2015년 12월 2주~2016년 5월 3주, 2016년 6월 2주, 2016년 7월 1주~2016년 8월 2주, 2016년 8월 4주~2016년 11월 3주, 2016년 12월 1주~2017년 9월 2주, 2017년 9월 4주, 2017년 10월 2주~2017년 12월 2주,2017년 12월 4주~2018년 3월 4주)
알라딘 외국어 베스트셀러 텝스 실전 분야 (2016년 7월 3주 주간베스트)
알라딘 외국어베스트셀러 텝스 분야 (2008~2016 역대베스트 기준) [해커스 텝스 보카 (개정2판) *YES24 국어/외국어 사전 영어-텝스/TEPS 분야 베스트셀러 (2017년 6월 2주~2018년 3월 4주) [텝스 중급 청해] *알라딘 텝스 베스트셀러 (2011년~2014년 9월 4주, 2014년 10월 1주~2014년 11월 4주, 2014년 12월 5주, 2015년 1월 5주~2015년 4월 3주, 2015년 5월 3주~2015년 9월 2주, 2015년 9월 4주~2015년 10월 3주, 2015년 10월 5주~2015년 11월 1주, 2015년 11월 4주, 2015년 12월 1주~2016년 3월 4주, 2016년 4월 2주, 2016년 4월 5주~2016년 5월 4주, 2016년 6월 3주, 2016년 7월 1주~2016년 9월 1주, 2016년 9월 3주, 2016년 10월 1주~2016년 10월 3주, 2016년 10월 5주~2016년 11월 1주, 2016년 11월 3주, 2016년 12월 1주~2017년 1월 3주, 2017년 2월 1주~2017년 5월 3주, 2017년 5월 5주~2017년 6월 2주, 2017년 7월 3주~2017년 9월 4주, 2017년 10월 2주~2017년 10월 5주,2017년 11월 4주~2018년 1월 3주,2018년 2월 2주~2018년 3월 4주)
알라딘 텝스 Listening 1위 (2014년 9월 4주)
알라딘 외국어베스트셀러 텝스 분야 (2008~2016 역대베스트 기준)
알라딘 외국어 베스트셀러 텝스 Listening 분야 (2014년 9월 4주 주간베스트 기준) [텝스 중급 독해/어휘] *YES24 국어/외국어 사전 영어-텝스/TEPS 분야 베스트셀러 (2011년 12월~2017년 10월 1주,2017년 10월 3주~2018년 3월 4주) yes24 국어 외국어 사전 베스트셀러 독해/문법/RC 분야 베스트셀러 (2017년 8월 1주 주별베스트 기준) [텝스 중급 문법] *교보문고 토익토플 베스트셀러(2017년 5월 29일~2017년 6월 15일, 2017년 6월 28일~2017년 7월 8일,2017년 7월 10일~2017년 7월 14일,2017년 7월 16일~2017년 8월 4일,2017년 8월 7일 ~2017년 8월 20일,2017년 8월 22일~2017년 9월 12일, 2017년 9월 14일,2017년 9월 28일~2017년 9월 29일,2017년 9월 30일~2017년 10월 6일,2017년 10월 8일~2017년 10월 13일,2017년 10월 14일~2017년 10월 20일,2017년 10월 22일~2017년 10월 27일,2017년 10월 28일.2017년 10월 30일~2017년 11월 3일,2017년 11월 4일~2017년 11월 10일,2017년 11월 11일~2017년 11월 17일,2017년 11월 18일~2017년 11월 21일,2017년 11월 28일~2017년 12월 08일,2017년 12월 09일~2017년 12월 14일,2017년 12월 16일~2017년 12월 22일,2017년 12월 23일~2017년 12월 24일,2017년 12월 26일~2018년 1월 19일,2018년 1월 20일~2018년 1월 26일,2018년 1월 27일,2018년 1월 29일~2018년 2월 2일,2018년 2월 4일~2018년 2월 9일,2018년 2월 11일~2018년 2월 16일,2018년 2월 17일~2018년 3월 2일,2018년 3월 4일~2018년 3월 9일,2018년 3월 10일~2018년 3월 16일,2018년 3월 18일~2018년 3월 23일,2018년 3월 24일~2018년 3월 30일) [서울대 텝스공식문제 최신기출 2 문제와 해설] *알라딘 텝스 베스트셀러 (2010년~2014년 1월 2주, 2014년 7월 2주~2014년 8월 3주, 2014년 8월 5주~2014년 9월 2주, 2014년 10월 1주~2014년 10월 2주, 2014년 10월 4주, 2014년 11월 4주~2014년 12월 2주, 2015년 2월 4주~2015년 3월 1주, 2015년 3월 5주, 2015년 4월 3주, 2015년 5월 5주~2015년 6월 4주, 2015년 7월 2주, 2015년 7월 5주~2015년 8월 1주, 2015년 12월 5주~2016년 1월 4주, 2016년 2월 1주, 2016년 2월 4주~2016년 2월 5주, 2016년 3월 2주, 2016년 4월 2주, 2016년 5월 4주, 2016년 7월 2주, 2016년 7월 4주~2016년 8월 1주, 2016년 8월 3주~2016년 8월 5주, 2016년 10월 3주, 2016년 10월 5주, 2016년 11월 4주, 2016년 12월 3주, 2017년 1월 1주, 2017년 1월 3주~2017년 1월 4주, 2017년 2월 2주, 2017년 5월 3주,2017년 6월 3주~2017년 7월 1주, 2017년 7월 3주~2017년 7월 4주, 2017년 10월 5주,2017년 11월 4주,2018년 1월 3주,2018년 1월 5주~2018년 2월 1주,2018년 2월 3주~2018년 3월 4주)
알라딘 외국어베스트셀러 텝스 분야 (2008~2016 역대베스트 기준) [서울대 공식최신기출 1200제 1 문제집] *교보문고 토익토플 베스트셀러(2017년 6월1일~2017년 6월 2일, 2017년 6월 4일 ~2017년 6월 12일, 6월 17일,2017년 6월 20일~2017년 7월 8일,2017년 7월 10일~2017년 7월 14일,2017년 7월 16일~2017년 7월 25일, 2017년 7월 27일~2017년 8월 4일,2017년 8월 7일~2017년 8월 8일,2017년 8월 12일~2017년 9월 11일, 2017년 9월 13일~2017년 9월 14일,2017년 9월 17일~2017년 9월 22일,2017년 9월 23일~2017년 9월 29일,2017년 10월 1일~2017년 10월 6일,2017년 10월 11일~2017년 10월 13일,2017년 10월 14일~2017년 10월 19일,2017년 10월 31일~2017년 11월 3일,2017년 11월 4일~2017년 11월 10일,2017년 11월 11일~2017년 11월 17일,2017년 11월 18일~2017년 11월 24일,2017년 11월 30일~2017년 12월 08일,2017년 12월 10일~2017년 12월 15일,2017년 12월 16일~2017년 12월 17일,2017년 12월 20일~2017년 12월 22일,2017년 12월 23일~2018년 1월 19일,2018년 1월 21일~2018년 1월 26일,2018년 1월 27일,2018년 1월 29일~2018년 2월 2일,2018년 2월 4일~2018년 2월 9일,2018년 2월 11일~2018년 2월 16일,2018년 2월 17일~2018년 2월 22일,2018년 3월 4일~2018년 3월 9일,2018년 3월 10일~2018년 3월 13일,2018년 3월 15일~2018년 3월 16일,2018년 3월 18일,2018년 3월 28일~2018년 3월 30일)
*교보문고 외국어 베스트셀러 (2017년 12월 02일~2017년 12월 08일) [서울대 공식최신기출 1200제 1 해설집] *알라딘 텝스 베스트셀러 (2016년 8월 5주~2016년 10월 3주, 2016년 11월 1주, 2016년 11월 3주, 2016년 12월 2주~2017년 1월 3주, 2017년 2월 2주~2017년 3월 2주, 2017년 3월 4주~2017년 4월 1주, 2017년 5월 1주, 2017년 5월 5주~2017년 7월 4주, 2017년 8월 2주~2017년 9월 1주, 2017년 9월 4주, 2017년 10월 3주, 2017년 11월 1주~2017년 11월 2주,2017년 11월 4주~2017년 12월 1주,2017년 12월 3주~2017년 12월 4주,2018년 1월 2주,2018년 1월 5주~2018년 2월 1주,2018년 2월 3주~2018년 3월 4주)
알라딘 외국어베스트셀러 텝스 분야 (2008~2016 역대베스트 기준) [서울대 텝스관리위원회 공식 최신기출 Speaking&Writing] *YES24 국어/외국어 사전 영어-텝스/TEPS 분야 베스트셀러 (2014년 4월~2014년 12월, 2015년 1월 1주, 2015년 2월~2016년 5월, 2016년 8월~2016년 10월, 2017년 1월~2017년 4월,2017년 5월 4주~2017년 6월 2주,2017년 6월 4주~2017년 8월 3주,2017년 9월 2주,2017년 9월 4주,2017년 10월 3주, 2017년 11월 2주,2017년 11월 4주,2017년 12월 2주~2017년 12월 3주,2018년 2월 2주~2018년 2월 4주,2018년 3월 2주,2018년 3월 4주)
yes24 국어 외국어 사전 베스트셀러 기출문제/모의고사 분야 베스트셀러 (2017년 8월 월별베스트 기준) [서울대 텝스관리위원회 공식 최신기출 iTEPS] *알라딘 텝스 베스트셀러 (2014년 5월 4주~2014년 6월 1주, 2014년 7월 1주~2014년 8월 2주, 2014년 8월 5주~2014년 9월 1주, 2014년 9월 5주~2014년 10월 1주, 2014년 10월 4주~2014년 11월 2주, 2014년 11월 4주~2014년 12월 1주, 2015년 1월 2주~2015년 1월 4주, 2015년 3월 1주, 2015년 3월 3주, 2015년 5월 1주, 2015년 5월 4주, 2015년 6월 4주, 2015년 7월 5주 ~ 2015년 8월 3주, 2015년 9월 1주, 2015년 9월 5주~2015년 10월 1주, 2015년 11월 4주, 2016년 1월 1주~2016년 1월 2주, 2016년 1월 4주, 2016년 3월 1주~2016년 3월 2주, 2016년 3월 4주~2016년 3월 5주, 2016년 4월 3주, 2016년 4월 5주~2016년 5월 1주, 2016년 5월 3주~2016년 5월 4주, 2016년 7월 2주~2016년 8월 1주, 2016년 10월 1주, 2016년 12월 2주, 2017년 2월 1주~2017년 2월 2주, 2017년 3월 2주, 2017년 5월 2주~2017년 5월 4주, 2017년 6월 2주~2017년 6월 3주,2017년 7월 4주, 2017년 8월 1주, 2017년 8월 3주, 2017년 11월 1주,2017년 12월 2주,2017년 12월 4주,2018년 2월 3주~2018년 3월 4주)
알라딘 외국어베스트셀러 텝스 분야 (2008~2016 역대베스트 기준) [서울대 텝스관리위원회 공식 최신기출 1200제 2 문제집] *YES24 국어/외국어 사전 영어-텝스/TEPS 분야 베스트셀러 (2014년 7월 4주~2016년 11월, 2017년 1월~2017년 10월 5주, 2017년 11월 2주~2018년 1월 3주,2018년 2월 1주~2018년 3월 4주)
YES24 텝스 베스트셀러 텝스실전서 기준 1위 (2014년 8월 1주, 2014년 8월 3주~2014년 12월)
YES24 국어 외국어 사전 베스트셀러 기출문제/모의고사 분야 1위 (2017년 7월 1주,2018년 2월 2주 온라인주간집계 기준) [서울대 텝스관리위원회 공식 최신기출 1200제 2 해설집] *YES24 국어/외국어 사전 영어-텝스/TEPS 분야 베스트셀러 (2016년 9월~2017년 5월 2주, 2017년 5월 4주,2017년 6월 1주, 2017년 6월 4주~2017년 7월 1주, 2017년 7월 4주~2017년 9월 2주,2017년 9월 4주~2017년 10월 3주,2017년 11월 1주,2017년 11월 3주~2017년 12월 3주,2018년 1월 3주,2018년 2월 1주~2018년 3월 2주,2018년 3월 4주)
*YES24 국어/외국어 사전 영어-텝스/TEPS 분야 베스트셀러 기출문제/모의고사 분야 1위 (2017년 10월 2주~2017년 10월 3주) [서울대 텝스관리위원회 공식 최신기출 1200제 3 문제집] *교보문고 토익토플 베스트셀러(2017년 5월 29일~2017년 6월 10일,2017년 6월 22일~2017년 7월 8일,2017년 7월 10일~2017년 7월 14일,2017년 7월 16일~2017년 7월 18일, 2017년 7월 22일~2017년 8월 4일,2017년 8월 7일~2017년 8월 10일,2017년 8월 13일~2017년 9월 15일,2017년 9월 18일~2017년 9월 21일,2017년 9월 23일~2017년 9월 29일,2017년 9월 30일~2017년 10월 6일,2017년 10월 8일~2017년 10월 13일,2017년 10월 14일~2017년 10월 20일,2017년 10월 24일,2017년 10월 30일,2017년 11월 1일~2017년 11월 3일,2017년 11월 4일~2017년 11월 10일,2017년 11월 11일~2017년 11월 17일,2017년 11월 18일~2017년 11월 24일,2017년 12월 02일~2017년 12월 08일,2017년 12월 9일~2017년 12월 15일,2017년 12월 16일~2017년 12월 22일,2017년 12월 23일~2018년 1월 16일,2018년 1월 18일~2018년 1월 19일,2018년 1월 20일~2018년 1월 26일,2018년 1월 27일,2018년 1월 29일~2018년 2월 2일,2018년 2월 4일~2018년 2월 9일,2018년 2월 12일,2018년 2월 14일~2018년 2월 16일,2018년 2월 17일~2018년 3월 2일,2018년 3월 4일~2018년 3월 9일,2018년 3월 10일~2018년 3월 16일,2018년 3월 18일~2018년 3월 23일,2018년 3월 24일~2018년 3월 30일)
*교보문고 외국어 베스트셀러 (2017년 12월 02일~2017년 12월 07일) [서울대 텝스관리위원회 공식 최신기출 1200제 3 해설집] 교보문고 토익토플 베스트셀러(2017년 5월 28일~2017년 5월 30일, 2017년 6월 25일~2017년 6월 28일, 2017년 7월 1일,2017년 8월 8일,2017년 8월 13일~2017년 9월 5일,2017년 9월 8일~2017년 9월 15일,2017년 9월 18일~2017년 9월 21일,2017년 9월 23일~2017년 9월 26일,2017년 10월 1일,2017년 10월 14일~2017년 10월 17일,2017년 10월 30일,2017년 11월 4일~2017년 11월 5일,2017년 11월 7일~2017년 11월 10일,2017년 11월 11일~2017년 11월 15일,2017년 12월 18일~2017년 12월 22일,2017년 12월 23일~2017년 12월 29일,2018년 1월 6일,2018년 1월 9일~2018년 1월 12일,2018년 1월 23일~2018년 1월 26일,2018년 1월 27일,2018년 1월 29일~2018년 2월 2일,2018년 2월 4일~2018년 2월 5일,2018년 2월 14일~2018년 2월 16일,2018년 2월 17일~2018년 2월 18일,2018년 2월 20일~2018년 2월 21일,2018년 2월 25일~2018년 2월 27일,2018년 3월 1일~2018년 3월 2일,2018년 3월 4일~2018년 3월 7일,2018년 3월 23일,2018년 3월 24일~2018년 3월 30일) [해커스 텝스 리딩] YES24 텝스 베스트셀러 텝스리딩 기준 1위 (2009년~2015년 7월) YES24 국어외국어사전 베스트셀러 텝스 독해/문법/RC 분야 1위 (2017.03. 월별베스트) [해커스 텝스 리스닝] YES24 텝스 베스트셀러 텝스리스닝 기준 1위 (2009년~2014년 7월, 2014년 8월 4주~2015년 6월) YES24 텝스 베스트셀러 (2009년~2015년 6월) YES24 국어외국어사전 베스트셀러 텝스 청해/LC 분야 1위 (2017.03. 월별베스트) [해커스 텝스 실전 1200제 문제집] YES24 텝스 베스트셀러 (2010년 6월~2016년 1월) [서울대 텝스관리위원회 공식 최신기출 Speaking] YES24 텝스 베스트셀러 (2014년 1월~2014년 3월) [서울대 텝스공식문제 최신기출 1 : 문제와 해설 알라딘 텝스 베스트셀러 (2009년~2014년 4월 1주, 2014년 6월 2주~2014년 6월 4주, 2014년 7월 1주~2014년 7월 4주, 2014년 9월 3주~2014년 9월 4주, 2014년 10월 3주, 2014년 11월 2주, 2014년 11월 4주, 2014년 12월 4주~2015년 3월 1주, 2015년 3월 3주, 2015년 4월 1주, 2015년 5월 5주~2015년 6월 4주, 2015년 8월 3주~ 2015년 8월 4주, 2015년 9월 1주, 2015년 9월 4주, 2015년 10월 3주, 2015년 12월 3주, 2015년 12월 5주~2016년 1월 2주, 2016년 1월 4주, 2016년 2월 1주, 2016년 3월 1주)
알라딘 외국어베스트셀러 텝스 분야 (2008~2016 역대베스트 기준) [텝스 보카 교보문고 외국어 베스트셀러 (2013년 10월~2016년 9월 22일, 2016년 12월 23일, 2017년 1월 6일~2017년 4월 7일)
교보문고 토익토플 베스트셀러(2017년 5월 29일~2017년 7월 8일,2017년 7월 10일~2017년 7월 14일,2017년 7월 16일~2017년 8월 4일,2017년 8월 7일~2017년 8월 8일)
교보문고 외국어 베스트셀러 텝스보카 기준 1위 (2013년 12월~2014년 1월, 2014년 7월~2014년 8월 12일, 2014년 8월 27일~2014년 9월 9일, 2014년 10월 15일~2014년 10월 21일, 2015년 1월 14일~2015년 2월 3일, 2015년 12월 30일~2016년 1월 5일, 2016년 7월 25일~2016년 9월 22일) 2016 베스트셀러(교보문고 2016 인터넷 베스트셀러 외국어분야) 교보문고 외국어 베스트셀러 텝스(Teps) 분야 1위 (2017.4.10 온라인 주간집계 기준) [토플 리딩 베이직 3rd Edition] *교보문고 토익토플 베스트셀러 (2015년 9월 1일~2015년 9월 15일, 2015년 11월 25일~2015년 12월 29일, 2017 5월 13일~2017년 7월 8일,2017년 7월 10일~2017년 7월 14일,2017년 7월 16일~2017년 8월 4일,2017년 8월 7일~2017년 9월 15일,2017년 9월 17일~2017년 9월 22일,2017년 9월 23일~ 2017년 9월 29일,2017년 10월 8일~2017년 10월 13일,2017년 10월 14일~2017년 10월 20일,2017년 10월 22일~2017년 10월 27일,2017년 10월 28일.2017년 10월 30일~2017년 11월 3일,2017년 11월 4일~2017년 11월 10일,2017년 11월 11일~2017년 11월 17일,2017년 11월 18일~2017년 12월 08일,2017년 12월 9일~2017년 12월 15일,2017년 12월 16일~2017년 12월 22일,2017년 12월 23일~2018년 1월 19일,2018년 1월 20일~2018년 1월 26일,2018년 1월 27일,2018년 1월 29일~2018년 2월 2일,2018년 2월 4일~2018년 2월 9일,2018년 2월 11일~2018년 2월 16일,2018년 2월 17일~2018년 3월 2일,2018년 3월 4일~2018년 3월 9일,2018년 3월 10일~2018년 3월 16일,2018년 3월 18일~2018년 3월 23일,2018년 3월 24일~2018년 3월 30일)
2016 베스트셀러(교보문고 2016 인터넷 베스트셀러 외국어분야) [토플 리스닝 베이직 2nd] *YES24 국어/외국어 사전 영어-TOEFL/SAT/GRE 유학관련서 분야 베스트셀러 (2015년 11월~2018년 3월 4주) [해커스 토플 라이팅 베이직(2nd)] *YES24 국어/외국어 사전 영어-TOEFL/SAT/GRE 유학관련서 분야 베스트셀러 (2015년 7월~2018년3월 4주) [토플 스피킹 베이직 3rd Edition] *교보문고 토익토플 베스트셀러 (2017 5월 13일~2017년 7월 8일,2017년 7월 10일~2017년 7월 14일,2017년 7월 16일~2017년 8월 4일,2017년 8월 7일~2017년 9월 15일,2017년 9월 17일~2017년 9월 22일,2017년 9월 23일~ 2017년 9월 29일,2017년 10월 8일~2017년 10월 13일,2017년 10월 14일~2017년 10월 20일,2017년 10월 22일~2017년 10월 27일,2017년 10월 28일.2017년 10월 30일~2017년 11월 3일,2017년 11월 4일~2017년 11월 10일,2017년 11월 11일~2017년 11월 17일,2017년 11월 18일~2017년 12월 08일,2017년 12월 9일~2017년 12월 15일,2017년 12월 16일~2017년 12월 22일,2017년 12월 23일~2018년 1월 19일,2018년 1월 20일~2018년 1월 26일,2018년 1월 27일,2018년 1월 29일~2018년 2월 2일,2018년 2월 4일~2018년 2월 9일,2018년 2월 11일~2018년 2월 16일,2018년 2월 17일~2018년 3월 2일,2018년 3월 4일~2018년 3월 9일,2018년 3월 10일~2018년 3월 16일,2018년 3월 18일~2018년 3월 23일,2018년 3월 24일~2018년 3월 30일) [토플 리딩 인터미디엇 3rd Edition] *교보문고 토익토플 베스트셀러 (2015년 10월 28일~2015년 11월 3일, 2015년 12월 30일~2016년 1월0 12일, 2016년 1월 27일~2016년 2월 9일, 2016년 4월 20일~2016년 5월 3일, 2017년 5월 13일~2017년 7월 8일,2017년 7월 10일~2017년 7월 14일,2017년 7월 16일~2017년 8월 4일,2017년 8월 7일~2017년 9월 15일,2017년 9월 17일~2017년 9월 22일,2017년 9월 23일~ 2017년 9월 29일,2017년 10월 8일~2017년 10월 13일,2017년 10월 14일~2017년 10월 20일,2017년 10월 22일~2017년 10월 27일,2017년 10월 28일.2017년 10월 30일~2017년 11월 3일,2017년 11월 4일~2017년 11월 10일,2017년 11월 11일~2017년 11월 17일,2017년 11월 18일~2017년 12월 08일,2017년 12월 9일~2017년 12월 15일,2017년 12월 16일~2017년 12월 22일,2017년 12월 23일~2018년 1월 19일,2018년 1월 20일~2018년 1월 26일,2018년 1월 27일,2018년 1월 29일~2018년 2월 2일,2018년 2월 4일~2018년 2월 9일,2018년 2월 11일~2018년 2월 16일,2018년 2월 17일~2018년 3월 2일,2018년 3월 4일~2018년 3월 9일,2018년 3월 10일~2018년 3월 16일,2018년 3월 18일~2018년 3월 23일,2018년 3월 24일~2018년 3월 30일)
2016 베스트셀러(교보문고 2016 인터넷 베스트셀러 외국어분야) [토플 리스닝 인터미디엇 2nd Edition] *YES24 국어/외국어 사전 영어-TOEFL/SAT/GRE 유학관련서 분야 베스트셀러 (2016년 1월~2018년 3월 4주) [토플 라이팅 인터미디엇 3rd Edition] *YES24 국어/외국어 사전 영어-TOEFL/SAT/GRE 유학관련서 분야 베스트셀러 (2016년 1월~2018년 1월 1주,2018년 1월 3주~2018년 3월 4주) [토플 스피킹 인터미디엇 3rd] *교보문고 토익토플 베스트셀러 (2017 5월 13일~2017년 7월 8일,2017년 7월 10일~2017년 7월 14일,2017년 7월 16일~2017년 8월 4일,2017년 8월 7일~2017년 9월 15일,2017년 9월 17일~2017년 9월 22일,2017년 9월 23일~ 2017년 9월 29일,2017년 10월 8일~2017년 10월 13일,2017년 10월 14일~2017년 10월 20일,2017년 10월 22일~2017년 10월 27일,2017년 10월 28일.2017년 10월 30일~2017년 11월 3일,2017년 11월 4일~2017년 11월 10일,2017년 11월 11일~2017년 11월 17일,2017년 11월 18일~2017년 12월 08일,2017년 12월 9일~2017년 12월 15일,2017년 12월 16일~2017년 12월 22일,2017년 12월 23일~2018년 1월 19일,2018년 1월 20일~2018년 1월 26일,2018년 1월 27일,2018년 1월 29일~2018년 2월 2일,2018년 2월 4일~2018년 2월 9일,2018년 2월 11일~2018년 2월 16일,2018년 2월 17일~2018년 3월 2일,2018년 3월 4일~2018년 3월 9일,2018년 3월 10일~2018년 3월 16일,2018년 3월 18일~2018년 3월 23일,2018년 3월 24일~2018년 3월 30일) [해커스 토플 리딩(3rd)] *교보문고 토익토플 베스트셀러 (2015년 9월 18일~2017년 3월 9일, 2017년 4월 7일~2017년 5월 27일, 2017년 5월 29일~2017년 7월 8일,2017년 7월 10일~2017년 7월 14일,2017년 7월 16일~2017년 8월 4일,2017년 8월 7일~2017년 9월 15일,2017년 9월 17일~2017년 9월 22일,2017년 9월 23일~ 2017년 9월 29일,2017년 9월 30일~2017년 10월 6일,2017년 10월 8일~2017년 10월 13일,2017년 10월 14일~2017년 10월 20일,2017년 10월 27일,2017년 10월 28일.2017년 10월 30일~2017년 11월 3일,2017년 11월 4일~2017년 11월 10일,2017년 11월 11일~2017년 11월 17일,2017년 11월 18일~2017년 12월 08일,2017년 12월 9일~2017년 12월 15일,2017년 12월 16일~2017년 12월 22일,2017년 12월 23일~2018년 1월 19일,2018년 1월 20일~2018년 1월 26일,2018년 1월 27일,2018년 1월 29일~2018년 2월 2일,2018년 2월 4일~2018년 2월 9일,2018년 2월 11일~2018년 2월 16일,2018년 2월 17일~2018년 3월 2일,2018년 3월 4일~2018년 3월 9일,2018년 3월 10일~2018년 3월 16일,2018년 3월 18일~2018년 3월 23일,2018년 3월 24일~2018년 3월 30일)
*교보문고 토익토플 베스트셀러 토플리딩 기준 1위 (2015년 6월 10일~2015년 9월 1일, 2015년 9월 22일~2017년 3월 9일, 2017년 4월 7일~2017년 5월 25일, 2017년 5월 27일~2017년 6월 2일,2017년 10월 22일~2017년 10월 27일,2017년 10월 30일~2017년 11월 3일,2017년 11월 6일~2017년 11월 10일,2017년 11월 13일,2017년 12월 29일,2018년 1월 29일~2018년 2월 2일,2018년 2월 5일,2018년 2월 7일~2018년 2월 9일,2018년 2월 13일,2018년 2월 19일~2018년 2월 23일,2018년 3월 13일,2018년 3월 15일,2018년 3월 19일~2018년 3월 20일,2018년 3월 22일~2018년 3월 23일,2018년 3월 26일~2018년 3월 28일,2018년 3월 30일)
2016 베스트셀러(교보문고 2016 인터넷 베스트셀러 외국어분야)
교보문고 외국어 베스트셀러 토플 분야 1위(2017.01.02, 2017년 10월 16일온라인 주간 집계 기준)
교보문고 외국어 베스트셀러 토플(Toefl) 분야 1위 (2017.11.01 온라인 주간집계 기준)
교보문고 외국어 베스트셀러 토플(Toefl) 분야 1위~4위 (2017.11.01 온라인 주간집계 기준) [토플 리스닝 3판 *YES24 국어/외국어 사전 영어-TOEFL/SAT/GRE 유학관련서 분야 베스트셀러 (2016년 9월~2018년 3월 4주) [토플 라이팅 3rd Edition] *YES24 국어/외국어 사전 영어-TOEFL/SAT/GRE 유학관련서 분야 베스트셀러 (2016년 9월~2018년 1월 1주,2018년 1월 3주~2018년 3월 4주) [토플 스피킹 4판] *YES24 국어/외국어 사전 영어-TOEFL/SAT/GRE 유학관련서 분야 베스트셀러 (2016년 9월~2018년 1월 1주,2018년 1월 3주~2018년 3월 4주) [토플 액츄얼 테스트 리딩 2nd] *YES24 국어/외국어 사전 영어-TOEFL/SAT/GRE 유학관련서 분야 베스트셀러 (2016년 1월~2018년 3월 4주)
Yes24 국어/외국어/사전 베스트셀러 토플 분야 (2016년 4월 4주 주별베스트) [토플 액츄얼 테스트 리스닝 3rd] *YES24 국어/외국어 사전 영어-TOEFL/SAT/GRE 유학관련서 분야 베스트셀러 (2016년 1월~2018년 1월 2주,2018년 1월 5주~2018년 3월 4주) [해커스 토플 액츄얼 테스트 라이팅(2nd)] *교보문고 토익토플 베스트셀러 (2017 5월 13일~2017년 7월 8일,2017년 7월 10일~2017년 7월 14일,2017년 7월 16일~2017년 8월 4일,2017년 8월 7일~2017년 9월 15일,2017년 9월 17일~2017년 9월 22일,2017년 9월 23일~ 2017년 9월 29일,2017년 9월 30일~2017년 10월 6일,2017년 10월 8일~2017년 10월 13일,2017년 10월 14일~2017년 10월 20일,2017년 10월 22일~2017년 10월 27일,2017년 10월 28일.2017년 10월 30일~2017년 11월 3일,2017년 11월 4일~2017년 11월 10일,2017년 11월 11일~2017년 11월 17일,2017년 11월 18일~2017년 12월 08일,2017년 12월 9일~2017년 12월 15일,2017년 12월 16일~2017년 12월 22일,2017년 12월 23일~2018년 1월 19일,2018년 1월 20일~2018년 1월 26일,2018년 1월 27일,2018년 1월 29일~2018년 2월 2일,2018년 2월 4일~2018년 2월 9일,2018년 2월 11일~2018년 2월 16일,2018년 2월 17일~2018년 3월 2일,2018년 3월 4일~2018년 3월 9일,2018년 3월 10일~2018년 3월 16일,2018년 3월 18일~2018년 3월 23일,2018년 3월 24일~2018년 3월 30일) [해커스 토플 액츄얼 테스트 스피킹(2nd)] *교보문고 토익토플 베스트셀러 (2017 5월 13일~2017년 7월 8일,2017년 7월 10일~2017년 7월 14일,2017년 7월 16일~2017년 8월 4일,2017년 8월 7일~2017년 9월 15일,2017년 9월 17일~2017년 9월 22일,2017년 9월 23일~ 2017년 9월 29일,2017년 9월 30일~2017년 10월 6일,2017년 10월 8일~2017년 10월 13일,2017년 10월 14일~2017년 10월 20일,2017년 10월 22일~2017년 10월 27일,2017년 10월 28일.2017년 10월 30일~2017년 11월 3일,2017년 11월 4일~2017년 11월 10일,2017년 11월 11일~2017년 11월 17일,2017년 11월 18일~2017년 12월 08일,2017년 12월 9일~2017년 12월 15일,2017년 12월 16일~2017년 12월 22일,2017년 12월 23일~2018년 1월 19일,2018년 1월 20일~2018년 1월 26일,2018년 1월 27일,2018년 1월 29일~2018년 2월 2일,2018년 2월 4일~2018년 2월 9일,2018년 2월 11일~2018년 2월 16일,2018년 2월 17일~2018년 3월 2일,2018년 3월 4일~2018년 3월 9일,2018년 3월 10일~2018년 3월 16일,2018년 3월 18일~2018년 3월 23일,2018년 3월 24일~2018년 3월 30일) [해커스 보카 (2nd)] *교보문고 토익토플 베스트셀러(2017년 5월 28일~2017년 7월 8일,2017년 7월 10일~2017년 7월 14일,2017년 7월 16일~2017년 8월 4일,2017년 8월 7일~2017년 9월 15일,2017년 9월 17일~2017년 9월 22일,2017년 9월 23일~ 2017년 9월 29일,2017년 9월 30일~2017년 10월 6일,2017년 10월 8일~2017년 10월 13일,2017년 10월 14일~2017년 10월 20일,2017년 10월 22일~2017년 10월 27일,2017년 10월 28일.2017년 10월 30일~2017년 11월 3일,2017년 11월 4일~2017년 11월 10일,2017년 11월 11일~2017년 11월 17일,2017년 11월 18일~2017년 12월 08일,2017년 12월 9일~2017년 12월 15일,2017년 12월 16일~2017년 12월 22일,2017년 12월 23일~2018년 1월 19일,2018년 1월 20일~2018년 1월 26일,2018년 1월 27일,2018년 1월 29일~2018년 2월 2일,2018년 2월 4일~2018년 2월 9일,2018년 2월 11일~2018년 2월 16일,2018년 2월 17일~2018년 3월 2일,2018년 3월 4일~2018년 3월 9일,2018년 3월 10일~2018년 3월 16일,2018년 3월 18일~2018년 3월 23일,2018년 3월 24일~2018년 3월 30일)
*교보문고 외국어 베스트셀러 수험영어 토플 분야 1위(2017년 8월 25일, 2017년 8월 28일~2017년 9월 1일 ,2017년 9월 4일~2017년 9월 8일, 2017년 9월 11일~2017년 9월 15일,2017년 9월 18일~2017년 9월 22일,2017년 9월 25일~2017년 9월 29일,2017년 10월 10일~2017년 10월 13일,2017년 11월 14일~2017년 11월 17일,2017년 11월 20일,2017년 11월 23일~2017년 11월 24일,2017년 12월 11일~2017년 12월 15일,2017년 12월 18일~2017년 12월 22일,2017년 12월 26일~2017년 12월 28일,2018년 2월 6일,2018년 2월 12일.2018년 2월 14일,2018년 2월 26일~2018년 2월 28일,2018년 3월 2일,2018년 3월 6일~2018년 3월 9일,2018년 3월 12일,2018년 3월 14일,2018년 3월 16일 온라인 주간집계 기준)
교보문고 토익토플 베스트셀러 토플보카 기준 1위 (2015년 6월 10일~2017년 6월 2일)
교보문고 토익토플 베스트셀러 토플 분야 1위 (2006년~2015년 연간종합베스트)
2016 베스트셀러(교보문고 2016 인터넷 베스트셀러 외국어분야)
교보문고 토익토플 베스트셀러 토플 기준 1위(2006년~2016년 연간 종합 베스트) 교보문고 외국어 베스트셀러 토플분야 1위 (2017.08.03 온라인 주간집계 기준)
[스타토플 실전 리딩] *알라딘 토플 베스트셀러 (2016년 8월 5주~2016년 9월 3주, 2016년 10월 1주~2016년 11월 3주, 2016년 12월 1주~2017년 1월 3주, 2017년 5월 3주~2017년 7월 1주, 2017년 7월 3주~2017년 7월 4주, 2017년 8월 1주, 2017년 8월 3주~2017년 9월 4주, 2017년 10월 3주, 2017년 11월 2주~2018년 3월 4주)
알라딘 외국어베스트셀러 토플 분야 (2002~2016 역대베스트 기준)
알라딘 외국어 베스트셀러 토플 분야(2016년 7월 1주 주간 베스트) [스타토플 실전 라이팅] *알라딘 토플 베스트셀러 (2016년 8월 5주~2016년 9월 1주, 2016년 9월 3주, 2016년 10월 1주~2016년 11월 2주, 2016년 11월 4주~2016년 12월 1주, 2016년 12월 3주, 2017년 1월 1주~2017년 1월 3주, 2017년 5월 3주,2017년 5월 5주, 2017년 7월 1주, 2017년 7월 3주~2017년 7월 4주, 2017년 8월 3주~2017년 9월 1주, 2017년 9월 3주, 2017년 10월 2주, 2017년 11월 1주~2017년 11월 1주,2017년 11월 3주,2017년 12월 2주~2018년 1월 1주,2018년 1월 3주~2018년 3월 4주)
알라딘 외국어베스트셀러 토플 분야 (2002~2016 역대베스트 기준)
알라딘 외국어 베스트셀러 토플 분야(2016년 7월 1주 주간 베스트)
[스타토플 실전 리스닝] *교보문고 토익토플 베스트셀러 (2017 5월 13일~2017년 5월 26일, 2017년 5월 28일~2017년 6월 5일, 2017년 6월 10일 ~2017년 6월 28일, 2017년 7월 5일~2017년 7월 8일,2017년 7월 10일~2017년 7월 14일,2017년 7월 16일~2017년 7월 26일, 2017년 7월 28일~2017년 8월 30일, 2017년 8월 1일~2017년 8월 4일,2017년 8월 7일~2017년 9월 15일,2017년 9월 18일~2017년 9월 21일,2017년 9월 23일,2017년 9월 28일~2017년 9월 29일,2017년 9월 30일~2017년 10월 4일,2017년 10월 8일~2017년 10월 9일,2017년 10월 11일~2017년 10월 13일,2017년 10월 14일~2017년 10월 18일,2017년 10월 22일~2017년 10월 27일,2017년 10월 28일.2017년 10월 30일~2017년 11월 3일,2017년 11월 4일~2017년 11월 8일,2017년 11월 11일~2017년 11월 12일,2017년 11월 14일~2017년 11월 17일,2017년 11월 19일~2017년 11월 20일,2017년 11월 24일,2017년 12월 02일~2017년 12월 08일,2017년 12월 9일~2017년 12월 15일,2017년 12월 16일~2017년 12월 22일,2017년 12월 23일~2018년 1월 10일,2018년 1월 14일~2018년 1월 19일,2018년 1월 20일~2018년 1월 26일,2018년 1월 27일,2018년 2월 7일~2018년 2월 9일,2018년 2월 11일~2018년 2월 13일,2018년 2월 19일~2018년 2월 26일,2018년 2월 28일~2018년 3월 2일,2018년 3월 5일~2018년 3월 9일,2018년 3월 10일~2018년 3월 16일,2018년 3월 18일,2018년 3월 20일~2018년 3월 23일,2018년 3월 24일~2018년 3월 29일)
*교보문고 외국어 베스트셀러 (2017년 12월 04일~2017년 12월 08일)
교보문고 외국어 베스트셀러 토플 분야 (2016.08.16, 온라인 주간 집계 기준) [스타토플 실전 스피킹] *교보문고 토익토플 베스트셀러 (2017 5월 일~2017년 5월 21일, 2017년 5월 30일~2017년 6월 2일,2017년 6월 17일~2017년 7월 5일,2017년 7월 8일, 2017년 7월 14일, 2017년 7월 24일~2017년 7월 26일, 2017년 7월 28일~2017년 8월 4일,2017년 8월 7일,2017년 8월 9일~2017년 8월 14일,2017년 8월 17일~2017년 9월 6일,2017년 9월 8일~2017년 9월 15일,2017년 9월 19일~2017년 9월 21일,2017년 9월 23일~ 2017년 9월 26일,2017년 9월 28일~2017년 9월 29일,2017년 9월 30일~2017년 10월 6일,2017년 10월 8일~2017년 10월 9일,2017년 10월 12일~2017년 10월 13일,2017년 10월 14일~2017년 10월 20일,2017년 10월 31일~2017 11월 2일,2017년 11월 6일,2017년 11월 10일,2017년 11월 11일~2017년 11월 12일,2017년 12월 02일~2017년 12월 06일,2017년 12월 13일~2017년 12월 15일,2017년 12월 16일~2017년 12월 19일,2017년 12월 25일~2017년 12월 27일,2017년 12월 29일,2017년 12월 30일,2017년 12월 31일,2018년 1월 2일~2018년 1월 4일,2018년 1월 7일~2018년 1월 11일,2018년 1월 24일~2018년 1월 26일,2018년 1월 27일,2018년 1월 29일~2018년 2월 2일,2018년 2월 4일~2018년 2월 9일,2018년 2월 11일~2018년 2월 16일,2018년 2월 19일~2018년 2월 27일,2018년 3월 8일~2018년 3월 9일,2018년 3월 10일~2018년 3월 14일,2018년 3월 24일~2018년 3월 29일)
*교보문고 외국어 베스트셀러 (2017년 12월 04일~2017년 12월 08일) [해커스 토플 리딩 베이직 (초판~2판)] YES24 토플 베스트셀러 (2008년~2015년 9월) [해커스 토플 리스닝 베이직] YES24 토플 베스트셀러 (2008년~2015년 11월) [해커스 토플 스피킹 베이직 (초판~2판)] YES24 토플 베스트셀러 (2008년~2015년 9월) [해커스 토플 라이팅 베이직] 교보문고 토익토플 베스트셀러 토플 라이팅 기준 1위 (2008년~2012년)
교보문고 토익토플 베스트셀러 (2008년~2013년, 2015년 3월 18일~ 2015년 3월 24일, 2015년 4월 8일~2015년 4월 21일) [해커스 토플 리딩 인터미디엇 (초판~2판)] 교보문고 토익토플 베스트셀러 (2010년~2014년 1월, 2014년 5월~2014년 7월 8일, 2014년 7월 30일~2014년 8월 5일, 2014년 10월 15일~2014년 10월 21일, 2014년 10월 29일~2014년 11월 4일, 2014년 11월 26일~2014년 12월 9일, 2015년 1월 7일 ~ 2015년 1월 13일, 2015년 2월 11일~2월 17일, 2015년 4월 8일~2015년 4월 14일, 2015년 5월 6일~2015년 6월 16일, 2015년 6월 24일~2015년 8월 18일) [해커스 토플 리스닝 인터미디엇 (초판)] YES24 토플 베스트셀러 (2009년 7월~2014년 12월 4주, 2015년 1월~2016년 1월) [해커스 토플 스피킹 인터미디엇 (초판~2판)] 알라딘 토플 베스트셀러 (2009년~2014년 12월 2주, 2015년 1월 4주, 2015년 2월 1주~2016년 6월 2주, 2016년 8월 3주) 알라딘 토플 베스트셀러 토플스피킹 기준 1위 (2014년 5월 5주~2014년 6월 1주, 2014년 7월 5주~2014년 8월 1주) [해커스 토플 라이팅 인터미디엇 (초판~2판)] YES24 토플 베스트셀러 (2009년 10월~2014년 12월 4주, 2015년 1월~2016년 1월) [해커스 토플 리딩] YES24 토플 베스트셀러 토플리딩 기준 1위 (2008년~2011년 5월, 2011년 7월~2014년 12월 4주, 2015년 1월~2015년 6월) YES24 토플 베스트셀러 (2008년~2015년 7월) [해커스 토플 리스닝] 알라딘 토플 베스트셀러 토플리스닝 기준 1위 (2009년~2014년 2월 2주, 2014년 2월 4주~2014년 4월 4주, 2014년 5월 3주~2014년 9월 5주, 2014년 10월 3주~2015년 5월 3주, 2015년 6월 1주~2015년 6월 3주, 2015년 6월 5주~2015년 11월 2주, 2015년 11월 4주~2016년 6월 4주, 2016년 7월 4주~2016년 8월 3주) 알라딘 토플 베스트셀러 (2009년~2016년 8월 3주) 알라딘 영어듣기/말하기 베스트셀러 (2015년 6월 4주) [해커스 토플 스피킹] YES24 토플 베스트셀러 토플스피킹 기준 1위 (2008년~2012년 4월, 2012년 6월~2014년 12월 4주, 2015년 1월~2016년 6월, 2016년 8월) YES24 토플 베스트셀러 (2008년~2014년 12월 4주, 2015년 1월~2016년 8월) [해커스 토플 라이팅] YES24 토플 베스트셀러 토플라이팅 기준 1위 (2013년 6월~2014년 12월 4주, 2015년 1월~2016년 6월, 2016년 8월) YES24 토플 베스트셀러 (2008년~2014년 12월 4주, 2015년 1월~2016년 8월) [해커스 보카] 교보문고 토익토플 베스트셀러 토플보카 기준 1위 (2008년~2014년 12월 9일, 2015년 1월 7일~2015년 6월 9일) [해커스 토플 액츄얼 테스트 리딩] 알라딘 토플 베스트셀러 (2008년~2014년 12월 2주, 2015년 1월 1주~2015년 12월 1주) [해커스 토플 액츄얼 테스트 리스닝 (2nd)] YES24 토플 베스트셀러 (2008년 7월~2014년 12월 4주, 2015년 1월~2015년 8월, 2015년 10월~2016년 1월) [해커스 토플 액츄얼 테스트 스피킹] YES24 토플 베스트셀러 (2010년 10월~2014년 12월 4주, 2015년 1월~2015년 7월) [해커스 토플 액츄얼 테스트 라이팅] 알라딘 토플 베스트셀러 (2010년~2014년 12월 2주, 2015년 1월 1주~2015년 2월 3주, 2015년 3월 3주, 2015년 3월 5주 ~ 2015년 6월 2주) [해커스 자동발사 중국어 첫걸음 1탄] *YES24 국어/외국어 사전 중국어-중국어 입문서 분야 베스트셀러 (2017년 2월~2017년 11월 4주,2017년 12월 2주~2018년 1월 2주,2018년 1월 4주.2018년 1월 5주~2018년 3월 4주)
*YES24 국어/외국어 사전 중국어-중국어 회화/청취 분야 베스트셀러 (2017년 9월 4주,2017년 10월 3주~2017년 10월 5주,2017년 11월 2주~2017년 11월 4주,2017년 12월 2주~2018년 1월 1주,2018년 1월 4주~2018년 3월 3주)
YES24 국어외국어사전 베스트셀러 중국어입문서 분야 (2016.12.12, YES24베스트셀러) [해커스 자동발사 중국어 첫걸음 2탄] *YES24 국어/외국어 사전 중국어-중국어 입문서 분야 베스트셀러 (2017년 2월~2017년 5월 1주, 2017년 5월 3주~2017년 11월 4주,2017년 12월 2주~2018년 1월 2주,2018년 1월 4주~2018년 3월 4주)
*YES24 국어/외국어 사전 중국어-중국어 회화/청취 분야 베스트셀러 (2017년 9월 4주,2017년 10월 3주~2017년 10월 5주, 2017년 11월 2주~2017년 11월 4주,2017년 12월 2주~2017년 12월 4주,2018년 1월 4주~2018년 3월 3주) [해커스 新 HSK 6급 한 권으로 고득점 달성] *YES24 국어/외국어 사전 중국어-한어수평고시(HSK) 분야 베스트셀러 (2016년 1월~2017년 9월 3주, 2017년 10월 1주~2017년 11월 4주,2017년 12월 2주~2018년 1월 2주.2016년 1월 4주~2018년 3월 4주)
YES24 중국어 베스트셀러 HSK 분야 (2015.12.29 주별 베스트 기준)
YES24 국어외국어사전 베스트셀러 HSK분야 6급 기준 1위 (2016.09.19 YES24베스트셀러) [해커스 新 HSK 5급 한 권으로 정복] *알라딘 신 HSK 베스트셀러 (2014년 6월 3주~2014년 8월 2주, 2014년 8월 4주~2014년 9월 4주, 2014년 10월 1주, 2014년 10월 3주~2014년 10월 4주, 2014년 11월 2주, 2014년 11월 4주~2014년 12월 1주, 2014년 12월 5주~2015년 4월 1주, 2015년 5월 3주~2015년 5월 4주, 2015년 6월 3주~2017년 4월 2주, 2017년 4월 4주, 2017년 5월 3주~2017년 9월 4주, 2017년 10월 2주~2018년 1월 1주,2018년 1월 3주~2018년 3월 4주)
*알라딘 중국어 베스트셀러 (2018년 1월 5주~2018년 3월 4주) [해커스 新 HSK 4급 한권으로 합격] *알라딘 중국어 베스트셀러 (2014년 6월 3주, 2014년 6월 5주, 2014년 7월 2주~2014년 7월 3주, 2014년 7월 5주~2014년 10월 1주, 2014년 10월 3주~2014년 10월 4주, 2014년 11월 2주~2014년 11월 4주, 2014년 12월 5주~2015년 3월 5주, 2015년 5월 3주~2015년 10월 1주, 2015년 10월 3주~2017년 5월 3주, 2017년 5월 5주~2017년 6월 1주,2017년 6월 3주~2017년 9월 4주, 2017년 10월 2주~2017년 11월 2주,2017년 11월 4주~2017년 12월 4주,2018년 1월 3주~2018년 3월 4주)
*알라딘 신 HSK 베스트셀러(2018년 2월 1주~2018년 3월 4주) [해커스 新 HSK 3급 한 권으로 합격] *YES24 국어/외국어 사전 중국어-한어수평고시(HSK) 분야 베스트셀러 (2015년 7월~2017년 11월 4주,2017년 12월 2주~2018년 1월 2주,2018년 1월 4주~2018년 3월 4주)
YES24 국어외국어사전 베스트셀러 한어수평고시(HSK) 분야 1위 (2016.11.15, YES24베스트셀러) [해커스 HSK 4급 실전모의고사] *YES24 국어/외국어 사전 중국어-한어수평고시(HSK) 분야 베스트셀러(2018년 1월 4주,2018년 2월 1주~2018년 3월 4주)
[Hackers New SAT Reading: 10 Practice Tests] *교보문고 토익토플 베스트셀러(2017년 5월 30일, 2017년 6월 18일~2017년 6월 23일, 2017년 7월 1일~2017년 7월 8일,2017년 7월 10일~2017년 7월 14일,2017년 7월 16일~2017년 7월 31일,2017년 8월 2일~2017년 8월 4일,2017년 8월 7일~2017년 8월 11일,2017년 8월 15일~2017년 8월 28일, 2017년 8월 31일~2017년 9월 5일,2017년 9월 19일,2017년 9월 21일,2017년 9월 23일~2017년 9월 29일,2017년 10월 15일~2017년 10월 16일,2017년 12월 05일~2017년 12월 08일,2017년 12월 09일~2017년 12월 11일,2017년 12월 15일,2017년 12월 16일~2017년 12월 22일,2017년 12월 23일~2017년 12월 27일, 2017년 12월 31일~2018년 1월 8일,2018년 1월 17일~2018년 1월 19일,2018년 1월 20일~2018년 1월 22일,2018년 1월 29일~2018년 2월 1일,2018년 2월 11일~2018년 2월 16일,2018년 2월 17일~2018년 2월 22일,2018년 3월 4일~2018년 3월 9일,2018년 3월 10일~2018년 3월 12일)
*교보문고 외국어 베스트셀러 (2017년 12월 05일~2017년 12월 08일)
교보문고 외국어 베스트셀러 SAT/GRE/GMAT/IELTS 분야 1위 (2016.07.28, 온라인 주간 집계 기준) [스타 아이엘츠 실전 Writing (Academic Module)] *교보문고 토익토플 베스트셀러(2017년 5월 29일~2017년 7월 8일,2017년 7월 10일~2017년 7월 14일,2017년 7월 16일~2017년 8월 4일,2017년 8월 7일~2017년 8월 24일, 2017년 8월 27일~2017년 9월 15일,2017년 9월 18일~2017년 9월 21일,2017년 9월 23일~2017년 10월 6일, 2017년 10월 8일~ 2017년 10월 13일,2017년 10월 14일~2017년 10월 20일,2017년 10월 22일~2017년 10월 27일,2017년 10월 28일,2017년 10월 30일~2017년 11월 3일,2017년 11월 4일~2017년 11월 10일,2017년 11월 11일~2017년 11월 12일,2017년 11월 19일~2017년 11월 24일,2017년 12월 02일~2017년 12월 08일,2017년 12월 09일~2017년 12월 11일,2017년 12월 19일~2017년 12월 22일,2017년 12월 23일~2017년 12월 26일,2018년 1월 2일~2018년 1월 15일,2018년 1월 25일,2018년 1월 29일~2018년 2월 2일,2018년 2월 4일~2018년 2월9일,2018년 2월 11일~2018년 2월 16일,2018년 2월 17일~2018년 2월 22일,2018년 2월 26일~2018년 2월 27일,2018년 3월 4일~2018년 3월 9일,2018년 3월 10일~2018년 3월 16일,2018년 3월 18일~2018년 3월 23일,2018년 3월 24일~2018년 3월 30일)
*교보문고 외국어 베스트셀러 (2017년 12월 02일~2017년 12월 08일) [해커스 아이엘츠 베이직 리딩] *교보문고 토익토플 베스트셀러(2017년 12월 23일~2018년 1월 19일,2018년 1월 20일~2018년 1월 26일,2018년 1월 27일,2018년 1월 29일~2018년 2월 2일,2018년 2월 4일~2018년 2월9일,2018년 2월 11일~2018년 2월 16일,2018년 2월 17일~2018년 3월 2일,2018년 3월 4일~2018년 3월 9일,2018년 3월 10일~2018년 3월 16일,2018년 3월 18일~2018년 3월 23일,2018년 3월 24일~2018년 3월 30일) [해커스 아이엘츠 베이직 리스닝] *교보문고 토익토플 베스트셀러(2017년 12월 27일~2018년 1월 19일,2018년 1월 20일~2018년 1월 26일,2018년 1월 27일,2018년 1월 29일~2018년 2월 2일,2018년 2월 4일~2018년 2월9일,2018년 2월 11일~2018년 2월 16일,2018년 2월 17일~2018년 3월 2일,2018년 3월 4일~2018년 3월 9일,2018년 3월 10일~2018년 3월 16일,2018년 3월 18일~2018년 3월 23일,2018년 3월 24일~2018년 3월 30일) [해커스 아이엘츠 베이직 라이팅] *교보문고 토익토플 베스트셀러(2017년 12월 23일~2018년 1월 19일,2018년 1월 20일~2018년 1월 26일,2018년 1월 27일,2018년 1월 29일~2018년 2월 2일,2018년 2월 4일~2018년 2월9일,2018년 2월 11일~2018년 2월 16일,2018년 2월 17일~2018년 3월 2일,2018년 3월 4일~2018년 3월 9일,2018년 3월 10일~2018년 3월 16일,2018년 3월 18일~2018년 3월 23일,2018년 3월 24일~2018년 3월 30일) [해커스 아이엘츠 베이직 스피킹] *교보문고 토익토플 베스트셀러(2018년 2월 16일,2018년 2월 17일~2018년 3월 2일,2018년 3월 4일~2018년 3월 9일,2018년 3월 10일~2018년 3월 16일,2018년 3월 18일~2018년 3월 23일,2018년 3월 24일~2018년 3월 30일)
*교보문고 외국어 베스트셀러 () [해커스 아이엘츠 리딩] *교보문고 토익토플 베스트셀러(2017년 5월 29일~2017년 7월 8일,2017년 7월 10일~2017년 7월 14일,2017년 7월 16일~2017년 8월 4일,2017년 8월 7일~2017년 9월 15일,2017년 9월 17일~2017년 9월 21일,2017년 9월 23일~2017년 10월 6일, 2017년 10월 8일~ 2017년 10월 13일,2017년 10월 14일~2017년 10월 20일,2017년 10월 22일~2017년 10월 27일2017년 10월 28일,2017년 10월 30일~2017년 11월 3일,2017년 11월 4일~2017년 11월 10일,2017년 11월 11일~2017년 11월 17일,2017년 11월 18일~2017년 12월 08일,2017년 12월 9일~2017년 12월 15일,2017년 12월 16일~2017년 12월 22일,2017년 12월 23일~2018년 1월 19일,2018년 1월 20일~2018년 1월 26일,2018년 1월 27일,2018년 1월 29일~2018년 2월 2일,2018년 2월 4일~2018년 2월9일,2018년 2월 11일~2018년 2월 16일,2018년 2월 17일~2018년 3월 2일,2018년 3월 4일~2018년 3월 9일,2018년 3월 10일~2018년 3월 16일,2018년 3월 18일~2018년 3월 23일,2018년 3월 24일~2018년 3월 30일)
**교보문고 외국어 베스트셀러 SAT/GRE/GMAT/IELTS 분야 1위(2017년 8월 25일,2017년 9월 6일~2017년 9월 7일, 2017년 9월 11일~2017년 9월 15일,2017년 9월 18일~2017년 9월 22일,2017년 9월 25일~2017년 9월 29일, 2017년 10월 12일~2017년 10월 13일,2017년 10월 16일~2017년 10월 20일,2017년 10월 23일~2017년 10월 27일,2017년 10월 30일~2017년 11월 1일,2017년 11월 9일~2017년 11월 10일,2017년 11월 21일,2017년 11월 24일,2017년 12월 13일~2017년 12월 14일,2017년 12월 26일~2017년 12월 28일,2018년 2월 1일~2018년 2월 2일,2018년 2월 4일~2018년 2월 9일,2018년 2월 13일,2018년 2월 20일~2018년 2월 23일,2018년 3월 19일~2018년 3월 20일,2018년 3월 22일~2018년 3월 23일,2018년 3월 26일~2018년 3월 28일 온라인주간집계 기준)
교보문고 외국어 베스트셀러 SAT/GRE/GMAT/IELTS 분야 TOP4 (2017.7.25 온라인주간집계 기준)
교보문고 외국어 베스트셀러 SAT/GRE/GMAT/IELTS 1위 (2017.11.01, 온라인 주간집계 기준)
교보문고 외국어 베스트셀러 SAT/GRE/GMAT/IELTS 1위~4위 (2017.11.01, 온라인 주간집계 기준)
교보문고 외국어 베스트셀러 SAT/GRE/GMAT/IELTS 분야 1위 (2017.11.02 온라인 주간집계 기준) [해커스 아이엘츠 리스닝] *교보문고 토익토플 베스트셀러(2017년 5월 29일~2017년 7월 8일,2017년 7월 10일~2017년 7월 14일,2017년 7월 16일~2017년 8월 4일,2017년 8월 7일~2017년 9월 15일,2017년 9월 17일~2017년 9월 21일,2017년 9월 23일~2017년 10월 6일, 2017년 10월 8일~ 2017년 10월 13일,2017년 10월 14일~2017년 10월 20일,2017년 10월 22일~2017년 10월 27일2017년 10월 28일,2017년 10월 30일~2017년 11월 3일,2017년 11월 4일~2017년 11월 10일,2017년 11월 11일~2017년 11월 17일,2017년 11월 18일~2017년 12월 08일,2017년 12월 9일~2017년 12월 15일,2017년 12월 16일~2017년 12월 22일,2017년 12월 23일~2018년 1월 19일,2018년 1월 20일~2018년 1월 26일,2018년 1월 27일,2018년 1월 29일~2018년 2월 2일,2018년 2월 4일~2018년 2월9일,2018년 2월 11일~2018년 2월 16일,2018년 2월 17일~2018년 3월 2일,2018년 3월 4일~2018년 3월 9일,2018년 3월 10일~2018년 3월 16일,2018년 3월 18일~2018년 3월 23일,2018년 3월 24일~2018년 3월 30일)
*교보문고 외국어 베스트셀러 SAT/GRE/GMAT/IELTS 분야 1위 (2017년 8월 28일 ~ 2017년 9월 1일,2017년 9월 4일~2017년 9월 5일,2017년 12월 29일 온라인주간집계 기준)
교보문고 외국어 베스트셀러 SAT/GRE/GMAT/IELTS 분야 1위 (2017.7.25 온라인주간집계 기준)
교보문고 외국어 베스트셀러 SAT/GRE/GMAT/IELTS 분야 TOP4 (2017.7.25 온라인주간집계 기준)
교보문고 외국어 베스트셀러 SAT/GRE/GMAT/IELTS 1위~4위 (2017.11.01, 온라인 주간집계 기준) [해커스 아이엘츠 라이팅] *교보문고 토익토플 베스트셀러(2017년 6월 3일~2017년 7월 8일,2017년 7월 10일~2017년 7월 14일,2017년 7월 16일~2017년 8월 4일,2017년 8월 7일~2017년 9월 15일,2017년 9월 17일~2017년 9월 21일,2017년 9월 23일~2017년 10월 6일, 2017년 10월 8일~ 2017년 10월 13일,2017년 10월 14일~2017년 10월 20일,2017년 10월 22일~2017년 10월 27일2017년 10월 28일,2017년 10월 30일~2017년 11월 3일,2017년 11월 4일~2017년 11월 10일,2017년 11월 11일~2017년 11월 17일,2017년 11월 18일~2017년 12월 08일,2017년 12월 9일~2017년 12월 15일,2017년 12월 16일~2017년 12월 22일,2017년 12월 23일~2018년 1월 19일,2018년 1월 20일~2018년 1월 26일,2018년 1월 27일,2018년 1월 29일~2018년 2월 2일,2018년 2월 4일~2018년 2월9일,2018년 2월 11일~2018년 2월 16일,2018년 2월 17일~2018년 3월 2일,2018년 3월 4일~2018년 3월 9일,2018년 3월 10일~2018년 3월 16일,2018년 3월 18일~2018년 3월 23일,2018년 3월 24일~2018년 3월 30일)
*교보문고 외국어 베스트셀러 SAT/GRE/GMAT/IELTS 분야 1위 (2017년 9월 8일, 2017년 10월 10일~2017년 10월 11일,2017년 11월 2일~2017년 11월 3일,2017년 11월 6일~2017년 11월 8일,2017년 11월 13일~2017년 11월 17일,2017년 11월 20일.2017년 11월 22일~2017년 11월 23일,2017년 12월 15일,2017년 12월 18일~2017년 12월 20일,2018년 1월 29일~2018년 1월 31일,2018년 2월 14일,2018년 2월 19일,2018년 2월 28일,2018년 3월 2일,2018년 3월 6일~2018년 3월 9일,2018년 3월 12일~2018년 3월 16일 온라인 주간집계 기준)
교보문고 외국어 베스트셀러 SAT/GRE/GMAT/IELTS 분야 TOP4 (2017.7.25 온라인주간집계 기준)
교보문고 외국어 베스트셀러 SAT/GRE/GMAT/IELTS 1위~4위 (2017.11.01, 온라인 주간집계 기준) [해커스 아이엘츠 스피킹] *교보문고 토익토플 베스트셀러(2017년 5월 29일~2017년 7월 8일,2017년 7월 10일~2017년 7월 14일,2017년 7월 16일~2017년 8월 4일,2017년 8월 7일~2017년 9월 15일,2017년 9월 17일~2017년 9월 21일,2017년 9월 23일~2017년 10월 6일, 2017년 10월 8일~ 2017년 10월 13일,2017년 10월 14일~2017년 10월 20일,2017년 10월 22일~2017년 10월 27일2017년 10월 28일,2017년 10월 30일~2017년 11월 3일,2017년 11월 4일~2017년 11월 10일,2017년 11월 11일~2017년 11월 17일,2017년 11월 18일~2017년 12월 08일,2017년 12월 9일~2017년 12월 15일,2017년 12월 16일~2017년 12월 22일,2017년 12월 23일~2018년 1월 19일,2018년 1월 20일~2018년 1월 26일,2018년 1월 27일,2018년 1월 29일~2018년 2월 2일,2018년 2월 4일~2018년 2월 9일,2018년 2월 11일~2018년 2월 16일,2018년 2월 17일~2018년 3월 2일,2018년 3월 4일~2018년 3월 9일,2018년 3월 10일~2018년 3월 16일,2018년 3월 18일~2018년 3월 23일,2018년 3월 24일~2018년 3월 30일)
*교보문고 외국어 베스트셀러 SAT/GRE/GMAT/IELTS 분야 1위(2017년 12월 11일~2017년 12월 12일,2017년 12월 21일~2017년 12월 22일,2018년 2월 12일,2018년 2월 26일~2018년 2월 27일,2018년 3월 30일)
교보문고 외국어 베스트셀러 SAT/GRE/GMAT/IELTS 분야 1위 (2017.06.07, 온라인 주간집계 기준)
교보문고 외국어 베스트셀러 SAT/GRE/GMAT/IELTS 분야 TOP4 (2017.7.25 온라인주간집계 기준)
yes24 국어 외국어 사전 베스트셀러 IELTS 분야 1위 (2017.11.08 YES24 베스트셀러 기준)
교보문고 외국어 베스트셀러 SAT/GRE/GMAT/IELTS 1위~4위 (2017.11.01, 온라인 주간집계 기준) [해커스 아이엘츠 베이직 스피킹(구)] *YES24 국어/외국어 사전 영어-IELTS 분야 베스트셀러 (2012년 2월~2017년 5월 1주,2017년 5월 4주~2017년 7월 2주,2017년 7월 4주~2017년 9월 2주,2017년 10월 1주,2017년 10월 3주~2018년 2월 2주) [2주 만에 끝내는 해커스 토익스피킹 Level. 7 8(2018)] *교보문고 토익토플 베스트셀러 (2017년 5월 15일~2017년 5월 19일, 2017년 5월 29일~2017년 7월 8일,2017년 7월 10일~2017년 7월 14일,2017년 7월 16일~2017년 8월 4일,2017년 8월 7일~2017년 9월 15일,2017년 9월 17일~2017년 9월 22일,2017년 9월 23일~2017년 10월 6일, 2017년 10월 8일~2017년 10월 13일,2017년 10월 14일~2017년 10월 20일,2017년 10월 22일~2017년 10월 27일,2017년 10월 22일~2017년 10월 27일,2017년 10월 28일,2017년 10월 30일~2017년 11월 3일,2017년 11월 4일~2017년 11월 10일,2017년 11월 11일~2017년 11월 17일,2017년 11월 18일~2017년 12월 08일,2017년 12월 9일~2017년 12월 15일,2017년 12월 16일~2017년 12월 22일,2017년 12월 23일~2018년 1월 19일,2018년 1월 21일~2018년 1월 26일,2018년 1월 27일,2018년 1월 29일~2018년 2월 2일,2018년 2월 4일~2018년 2월 9일,2018년 2월 11일~2018년 2월 16일,2018년 2월 17일~2018년 3월 2일,2018년 3월 4일~2018년 3월 9일,2018년 3월 10일~2018년 3월 16일,2018년 3월 18일~2018년 3월 23일,2018년 3월 24일~2018년 3월 30일)
교보문고 외국어 베스트셀러 1위 (2015.08.17 일간베스트 기준)
2016 베스트셀러(교보문고 2016 인터넷 베스트셀러 토익분야)
교보문고 토익토플 베스트셀러 토익스피킹 기준 1위 (2015년 4월 22일 ~ 2015년 5월 5일, 2015년 5월 13일 ~ 2015년 6월 2일, 2015년 8월 18일~ 2015년 9월 1일, 2015년 12월 2일~2015년 12월 8일, 2016년 2월 24일~2016년 3월 1일, 2016년 3월 23일~2016년 3월 29일, 2016년 8월 3일~2016년 9월 22일, 2016년 11월 4일~2016년 11월 25일, 2017년 1월 20일~2017년 3월 24일, 2017년 4월 14일~2017년 4월 21일, 2017년 4월 24일~2017년 5월 12일,2017년 5월 20일~2017년 6월 2일) [2주 만에 끝내는 해커스 TOEIC 스피킹 Start(2015)] *교보문고 토익토플 베스트셀러 (2015년 5월 13일~2016년 8월 3일, 2016년 9월 1일~2017년 5월 12일,2017년 5월 15일~2017년 7월 8일,2017년 7월 10일~2017년 7월 14일,2017년 7월 16일~2017년 8월 4일,2017년 8월 7일~2017년 9월 15일,2017년 9월 17일~2017년 9월 22일,2017년 9월 23일~2017년 10월 6일, 2017년 10월 8일~2017년 10월 13일,2017년 10월 14일~2017년 10월 20일,2017년 10월 22일~2017년 10월 27일,2017년 10월 22일~2017년 10월 27일,2017년 10월 28일,2017년 10월 30일~2017년 11월 3일,2017년 11월 4일~2017년 11월 10일,2017년 11월 11일~2017년 11월 17일,2017년 11월 18일~2017년 12월 08일,2017년 12월 9일~2017년 12월 15일,2017년 12월 16일~2017년 12월 22일,2017년 12월 23일~2018년 1월 19일,2018년 1월 20일~2018년 1월 26일,2018년 1월 27일,2018년 1월 29일~2018년 2월 2일,2018년 2월 4일~2018년 2월 9일,2018년 2월 11일~2018년 2월 16일,2018년 2월 17일~2018년 3월 2일,2018년 3월 4일~2018년 3월 9일,2018년 3월 10일~2018년 3월 16일,2018년 3월 18일~2018년 3월 23일,2018년 3월 24일~2018년 3월 30일)
2016 베스트셀러(교보문고 2016 인터넷 베스트셀러 토익분야)
교보문고 토익토플 베스트셀러 토익스피킹 기준 1위 (2015년 6월 24일~2015년 6월 30일, 2015년 7월 21일~2015년 8월 11일, 2015년 9월 8일~2015년 12월 1일, 2015년 12월 9일~2016년 2월 23일, 2016년 3월 2일~2016년 3월 22일, 2016년 3월 30일~2016년 7월 25일, 2016년 9월 29일~2016년 10월 26일, 2016년 12월 2일~2017년 1월 13일) [5일 만에 끝내는 해커스 토익 TOEIC Speaking(토익스피킹) 실전 모의고사 12회] *YES24 국어/외국어 사전 영어-토익Speaking & Writing Test/TOEIC S&W 분야 베스트셀러 (2017년 6월 4주~2017년 10월 1주,2017년 10월 3주~2018년 3월 4주)
YES24 토익스피킹 베스트셀러 (2015년 9월~2017년 6월 월별 베스트 기준)
YES24 국어외국어사전 베스트셀러 토익Speaking&Writing Test/TOEIC S&W 분야 (2015년 9월~2017년 6월 월별베스트 기준)[2주 만에 끝내는 해커스 OPIc START (Intermediate 공략)(2016 최신개정판)] *YES24 국어/외국어 사전 영어-OPIC/G-TELP/ESPT 분야 베스트셀러 (2016년 9월~2018년 3월 4주)
*YES24 국어/외국어 사전 영어-OPIC/G-TELP/ESPT 분야 1위 (2016년 12월,2017년 10월 2주,2017년 11월 2주,2017년 12월 2주~2017년 12월 3주, 2018년 2월 4주)
YES24 국어 외국어 사전 베스트셀러 OPIC/G-TELP/ESPT외 기타 영어어학시험 분야 1위 (2017.12.15 주별베스트 기준)[2주 만에 끝내 는 해커스 OPIc (Advanced 공략)(2016 최신개정판)] *알라딘 오픽 베스트셀러 (2016년 7월 2주~2017년 9월 4주, 2017년 10월 2주~2018년 1월 1주,2018년 1월 3주~2018년 3월 4주)
*알라딘 오픽 베스트셀러 1위 (2016년 7월 3주~ 2016년 8월 1주, 2016년 8월 3주~2016년 11월 1주, 2016년 11월 3주, 2016년 11월 5주~2016년 12월 4주, 2017년 1월 2주~2017년4월 3주, 2017년 4월 5주~2017년 7월 3주, 2017년 7월 5주~2017년 9월 4주, 2017년 10월 2주~2017년 10월 5주, 2017년 11월 2주~2018년 1월 1주,2018년 1월 3주~2018년 3월 4주)
*알라딘 OPIc/인터뷰 영어 주간베스트 1위 (2017년 8월 4주~2017년 9월 1주, 2017년 9월 3주~2017년 9월 4주, 2017년 10월 2주~2017년 10월 5주, 2017년 11월 2주~2017년 11월 4주,2017년 12월 2주~2017년 12월 2주,2017년 12월 4주~2018년 1월 1주,2018년 1월 3주~2018년 1월 4주,2018년 2월 1주~2018년 3월 4주)
알라딘 외국어 베스트셀러 OPIc/인터뷰영어 분야 1위 (2017년 11월 1주 주간베스트 기준) [2주 만에 끝내는 해커스 OPIc Start (Intermediate 공략)] 알라딘 오픽 베스트셀러 1위 (2015년 6월 1주~2015년 7월 1주, 2015년 7월 4주, 2015년 8월 4주, 2015년 9월 2주~2015년 10월 1주, 2015년 10월 5주~2015년 11월 1주, 2015년 11월 3주, 2016년 1월 1주~2016년 1월 2주, 2016년 1월 5주~2016년 2월 1주, 2016년 3월 4주~2016년 3월 5주, 2016년 4월 4주~2016년 4월 5주, 2016년 5월 3주~2016년 5월 4주, 2016년 6월 4주~2016년 7월 1주)
알라딘 오픽 베스트셀러 (2015년 4월 5주~2015년 6월 5주, 2015년 7월 3주~2016년 9월 3주)
[해커스 오픽 스타트] 교보문고 외국어 베스트셀러 오픽 기준 1위 (2012년 9월~2014년 8월 5일, 2014년 8월 27일~2014년 11월 18일, 2015년 1월 7일~2015년 2월 17일, 2015년 3월 4일~2015년 3월 24일) 교보문고 외국어 베스트셀러 (2012년 9월~2014년 8월 5일, 2014년 8월 27일~2014년 11월 18일, 2015년 1월 7일~2015년 2월 17일, 2015년 3월 4일~2015년 4월 14일) [2주 만에 끝내는 해커스 OPIc (Advanced 공략)] YES24 오픽 베스트셀러 1위 (2015년 7월~2015년 10월, 2016년 2월~2016년 3월) YES24 오픽 베스트셀러 (2015년 2월~2016년 8월) [해커스 토익 스피킹 스타트(초판~3판)] 교보문고 토익토플 베스트셀러 토익스피킹 기준 1위 (2011년~2015년 4월 21일) [2주 만에 끝내는 해커스 토익 스피킹 Level 7 8 알라딘 토익 베스트셀러 토익스피킹 기준 1위 (2015년 2월 3주~2015년 2월 4주) 알라딘 토익 베스트셀러 (2015년 1월 5주~2015년 4월 4주) [그래머 게이트웨이 베이직 3rd] *교보문고 외국어 베스트셀러 (2014년 1월~2017년 7월 8일,2017년 7월 10일~2017년 7월 14일,2017년 7월 16일~2017년 8월 4일,2017년 8월 7일~ 2017년 9월 15일,2017년 9월 18일~2017년 9월 22일,2017년 9월 23일~2017년 10월 6일,2017년 10월 8일~2017년 10월 13일,2017년 10월 14일~2017년 10월 20일,2017년 10월 22일~2017년 10월 27일,2017년 10월 28일,2017년 10월 30일~2017년 11월 3일,2017년 11월 4일~2017년 11월 10일,2017년 11월 11일~2017년 11월 17일,2017년 11월 18일~2017년 12월 08일,2017년 12월 9일~2017년 12월 15일,2017년 12월 16일~2017년 12월 22일,2017년 12월 23일~2018년 1월 19일,2018년 1월 20일~2018년 1월 26일,2018년 1월 27일,2018년 1월 29일~2018년 2월 2일,2018년 2월 4일~2018년 2월 9일,2018년 2월 11일~2018년 2월 16일,2018년 2월 17일~2018년 3월 2일,2018년 3월 4일~2018년 3월 9일,2018년 3월 11일~2018년 3월 16일,2018년 3월 18일~2018년 3월 23일,2018년 3월 24일,2018년 3월 26일~2018년 3월 30일)
교보문고 2015 종합 베스트셀러 외국어분야 1위
교보문고 외국어 베스트셀러 1위 (2013년 7월~2013년 8월, 2014년 10월 22일~2014년 10월 28일, 2014년 11월 5일~2014년 12월 2일, 2015년 3월 25일~2015년 3월 31일, 2015년 5월 13일~ 2015년 5월 19일, 2015년 6월 10일~2015년 6월 30일, 2015년 7월 21일~2015년 8월 11일, 2015년 9월 9일~2015년 12월 29일)
교보문고 외국어 베스트셀러 영문법 기준 1위 (2011년~2012년, 2013년 5월~2013년 11월, 2014년 7월 23일~2014년 10월 28일, 2014년 11월 5일~2014년 12월 9일, 2015년 3월 4일~2015년 3월 31일, 2015년 5월 6일~2015년 6월 30일, 2015년 8월 4일, 2015년 9월 15일~2016년 1월 12일, 2016년 6월 30일) 2016 베스트셀러(교보문고 2016 인터넷 베스트셀러 외국어분야)
교보문고 외국어 베스트셀러 영어문법/독해/작문 분야 1위 (2017.2.8, 2017.04.23, 2017.05.22 온라인주간집계 기준)
교보문고 외국어 베스트셀러 영어 문법/독해/작문 분야 1위 (2017.7.03 온라인 주간집계 기준)
교보문고 외국어 베스트셀러 영어문법/독해/작문 분야 1위 (2017.7.24 온라인주간집계 기준)
교보문고 외국어 베스트셀러 영어문법/독해/작문 분야 1위 (2017.8.9 온라인주간집계 기준) [그래머 게이트웨이 인터미디엇 *교보문고 외국어 베스트셀러 (2014.10.6 온라인주간집계 기준, 2014년 10월 1일~ 2016년 8월 3일, 2016년 9월 1일~2016년 10월 18일, 2016년 11월 4일~2016년 12월 23일, 2017년 1월 6일~2017년 1월 26일, 2017년 2월 10일~2017년 4월 14일, 2017년 4월 24일~2017년 7월 8일,2017년 7월 10일~2017년 7월 14일,2017년 7월 16일~2017년 8월 4일,2017년 8월 7일~ 2017년 9월 15일,2017년 9월 18일~2017년 9월 22일,2017년 9월 23일~2017년 10월 6일,2017년 10월 8일~2017년 10월 13일,2017년 10월 14일~2017년 10월 20일,2017년 10월 22일~2017년 10월 27일,2017년 10월 28일,2017년 10월 30일~2017년 11월 3일,2017년 11월 4일~2017년 11월 10일,2017년 11월 11일~2017년 11월 17일,2017년 11월 18일~2017년 12월 08일,2017년 12월 9일~2017년 12월 15일,2017년 12월 16일~2017년 12월 22일,2017년 12월 23일~2018년 1월 19일,2018년 1월 20일~2018년 1월 26일,2018년 1월 27일,2018년 1월 29일~2018년 2월 2일,2018년 2월 4일~2018년 2월 9일,2018년 2월 11일~2018년 2월 16일,2018년 2월 17일~2018년 3월 2일,2018년 3월 4일~2018년 3월 9일,2018년 3월 11일~2018년 3월 16일,2018년 3월 18일~2018년 3월 23일,2018년 3월 24일,2018년 3월 26일~2018년 3월 30일)
2016 베스트셀러(교보문고 2016 인터넷 베스트셀러 외국어분야) [상황별 바로 찾아 말하는 해커스톡 왕초보 여행영어] *교보문고 외국어 베스트셀러 (2016년 8월 26일, 2016년 9월 29일~2016년 10월 18일, 2016년 11월 11일~2016년 11월 18일, 2016년 12월 2일~2016년 12월 9일, 2017년 2월 10일~2017년 4월 21일, 2017 4월 24일~2017년 7월 8일,2017년 7월 10일~2017년 7월 14일,2017년 7월 16일~2017년 8월 4일,2017년 8월 7일~ 2017년 8월 14일,2017년 8월 17일~2017년 9월 15일,2017년 9월 18일~2017년 9월 22일,2017년 9월 23일~2017년 10월 6일,2017년 10월 8일~2017년 10월 13일,2017년 10월 14일~2017년 10월 20일,2017년 10월 22일~2017년 10월 27일,2017년 10월 28일,2017년 10월 30일~2017년 11월 3일,2017년 11월 4일~2017년 11월 10일,2017년 11월 11일~2017년 11월 17일,2017년 11월 18일~2017년 12월 08일,2017년 12월 9일~2017년 12월 15일,2017년 12월 16일~2017년 12월 22일,2017년 12월 23일~2018년 1월 19일,2018년 1월 20일~2018년 1월 26일,2018년 1월 27일,2018년 1월 29일~2018년 2월 2일,2018년 2월 4일~2018년 2월 9일,2018년 2월 11일~2018년 2월 16일,2018년 2월 17일~2018년 3월 2일,2018년 3월 4일~2018년 3월 9일,2018년 3월 11일~2018년 3월 16일,2018년 3월 18일~2018년 3월 23일,2018년 3월 24일,2018년 3월 26일~2018년 3월 30일) [해커스톡 자동발사영어 왕초보 말문트기 1] *알라딘 영어회화 베스트셀러 (2016년 12월 3주~2017년 4월 1주, 2017년 5월 1주, 2017년 5월 3주~2017년 7월 3주, 2017년 8월 1주~2017년 8월 2주, 2017년 9월 1주, 2017년 9월 3주~2017년 9월 4주, 2017년 10월 2주~2017년 10월 5주, 2017년 11월 2주~2017년 11월 3주,2017년 12월 1주,2017년 12월 4주~2018년 1월 1주, 2018년 1월 3주~2018년 2월 1주,2018년 2월 3주,2018년 3월 1주~2018년 3월 4주) [해커스톡 자동발사영어 왕초보 말문트기 2] *YES24 국어/외국어 사전 영어-영어입문서/학습법 분야 베스트셀러 (2017년 3월 1주~2017년 5월 2주,2017년 5월 4주~2017년 9월 3주,2017년 10월 1주~2017년 10월 5주, 2017년 11월 2주~2017년 11월 3주,2017년 12월 1주~2017년 12월 2주,2017년 12월 4주~2018년 1월 1주,2018년 1월 3주~2018년 3월 4주)
*YES24 국어/외국어 사전 영어-영어회화/생활영어 분야 베스트셀러 (2017년 3월 1주~2017년 5월 2주,2017년 5월 5주~2017년 9월 3주,2017년 10월 1주~2017년 10월 3주,2017년 11월 1주,2017년 11월 3주,2017년 12월 1주~2017년 12월 2주,2017년 12월 4주~2018년 1월 1주,2018년 1월 3주~2018년 3월 4주)
YES24 \\'해커스톡\\' 검색 시 인기도 TOP 6 (2017.02.10 기준) [해커스톡 자동발사영어 기초영어 말하기 1] *YES24 국어/외국어 사전 영어-영어입문서/학습법 분야 베스트셀러 (2017년 3월~2017년 10월 1주,2017년 11월 1주~2017년 11월 3주,2017년 12월 1주~2018년 1월 1주,2018년 1월 3주~2018년 3월 4주)
*YES24 국어/외국어 사전 영어-영어회화/생활영어 분야 베스트셀러 (2017년 3월~2017년 10월 1주,2017년 11월 1주~2017년 11월 3주,2017년 12월 1주~2018년 1월 1주,2018년 1월 3주~2018년 3월 3주)
YES24 \\'해커스톡\\' 검색 시 인기도 TOP 6 (2017.02.10 기준) [해커스톡 자동발사영어 기초영어 말하기 2] *YES24 국어/외국어 사전 영어-영어입문서/학습법 분야 베스트셀러 (2017년 3월~2017년 7월 5주,2017년 8월 4주~2017년 9월 3주,2017년 10월 1주,2017년 11월 1주~2017년 11월 3주,2017년 12월 1주~2018년 1월 1주,2018년 1월 3주.2018년 2월 1주~2018년 3월 4주)
*YES24 국어/외국어 사전 영어-영어회화/생활영어 분야 베스트셀러 (2017년 3월~2017년 7월 5주,2017년 8월 4주~2017년 9월 3주, 2017년 10월 1주,2017년 11월 1주~2017년 11월 2주,2017년 12월 1주~2018년 1월 1주,2018년 1월 3주~2018년 3월4주)
YES24 \\'해커스톡\\' 검색 시 인기도 TOP 6 (2017.02.10 기준)
[해커스톡 자동발사영어 레벨업 길게 말하기] *알라딘 영어회화 베스트셀러 (2016년 1월 2주~2016년 12월 3주, 2016년 12월 5주~2017년 1월 4주, 2017년 2월 1주~2017년 3월 2주, 2017년 4월 1주, 2017년 4월 3주,2017년 5월 5주,2017년 6월 3주, 2017년 7월 1주~2017년 7월 2주, 2017년 7월 4주, 2017년 8월 3주, 2017년 9월 4주,2017년 11월 3주~2017년 11월 4주,2017년 12월 4주,2018년 1월 4주,2018년 3월 4주) [해커스톡 자동발사영어 레벨업 길게 말하기 2] *알라딘 영어회화 베스트셀러 (2017년 4월 3주, 2017년 5월 1주,2017년 5월 5주, 2017년 6월 2주,2017년 7월 1주, 2017년 7월 4주, 2017년 8월 2주,2018년 2월 1주,2018년 3월 4주) [해커스톡 왕초보영어] YES24 영어입문서 베스트셀러 (2016년 6월~2017년 1월) [해커스톡 왕초보영어 2] 알라딘 영어회화 베스트셀러 (2016년 1월 3주~2016년 2월 1주, 2016년 2월 4주~2016년 3월 4주, 2016년 4월 3주~2016년 5월 1주, 2016년 5월 5주, 2016년 6월 3주~2016년 7월 1주, 2016년 7월 3주~2016년 9월 1주, 2016년 9월 3주, 2016년 10월 1주~2016년 12월 1주) [해커스톡 기초영어] YES24 영어회화 베스트셀러 (2015년 12월, 2016년 2월~2017년 1월) [해커스톡 기초영어 2] YES24 국어 외국어 사전 베스트셀러 영어회화/생활영어 분야(2016년 2월 1주 주별 베스트 기준) YES24 영어회화 베스트셀러 (2016년 2월~2017년 1월) [해커스톡 기초영어 3] Yes24 국어/외국어/사전 베스트셀러 영어회화 분야 (2016년 3월 2주 주별베스트) YES24 영어회화 베스트셀러 (2016년 4월~2017년 1월) YES24 영어입문서 베스트셀러 (2016년 6월~2017년 1월) [리딩 인트로] *YES24 국어/외국어 사전 영어-영어 독해/문법/작문/번역 분야 베스트셀러 (2017년 9월 4주~2018년 3월 4주)
*YES24 국어/외국어 사전 영어-TOEFL/SAT/GRE 유학관련서 분야 베스트셀러 (2008년~2014년 12월 4주, 2015년 1월~2018년 1월 1주,2018년 1월 3주~2018년 3월 4주) [리스닝 인트로 *YES24 국어/외국어 사전 영어-영어 청취/발음 분야 베스트셀러 (2017년 9월 4주,2017년 10월 3주~2018년 3월 4주)
*yes24 외국어/외국어 사전 영어-TOEFL/SAT/GRE 유학관련서 분야 베스트셀러 (2008년~2014년 12월 4주, 2015년 1월~2018년 1월 1주,2018년 1월 4주~2018년 3월 4주) [리딩 스타트] *교보문고 토익토플 베스트셀러 (2017년 5월13일~2017년 5월 24일, 2017년 5월 31일~2017년 6월 8일,2017년 6월 15일 ~2017년 6월 23일,2017년 7월 10일~2017년 7월 14일, 2017년 7월 26일~2017년 8월 2일,2017년 8월 17일~2017년 8월 24일, 2017년 8월 26일,2017년 9월 6일~2017년 9월 7일,2017년 9월 22일,2017년 9월 23일~2017년 9월 28일,2017년 10월 10일~2017년 10월 13일,2017년 10월 14일~2017년 10월 16일,2017년 11월 4일~2017년 11월 6일,2017년 11월 25일~2017년 12월 01일,2017년 12월06일,2017년 12월 10일~2017년 12월 15일,2017년 12월 16일~2017년 12월 19일,2018년 1월 1일~2018년 1월 3일,2018년 1월 5일~2018년 1월 9일,2018년 1월 14일,2018년 1월 17일~2018년 1월 19일,2018년 1월 20일~2018년 1월 26일,2018년 1월 27일,2018년 1월 29일~2018년 2월 2일,2018년 2월 14일~2018년 2월 16일,2018년 2월 17일~2018년 2월 20일,2018년 3월 10일~2018년 3월 13일,2018년 3월 15일~2018년 3월 16일,2018년 3월 29일~2018년 3월 30일)
*교보문고 외국어 베스트셀러 (2017년 12월 06일) *알라딘 토플 베스트셀러 (2008년~2014년 3월 5주, 2014년 4월 3주~2014년 4월 5주, 2014년 6월 2주, 2014년 7월 5주~2014년 8월 2주, 2014년 8월 4주~2014년 10월 1주, 2014년 10월 3주~2014년 12월 1주, 2015년 1월 4주~2015년 3월 3주, 3월 5주, 2015년 5월 1주, 2015년 5월 4주, 2015년 6월 2주, 2015년 6월 5주~2015년 8월 5주, 2015년 9월 4주~2015년 10월 3주, 2015년 10월 5주~2015년 11월 1주, 2015년 11월 3주~2016년 4월 4주, 2016년 5월 2주~2016년 5월 3주, 2016년 6월 3주, 2016년 7월 3주, 2016년 8월 4주~2016년10월 1주, 2016년 10월 3주~2016년 10월 5주, 2016년 11월 2주~2016년 11월 4주, 2016년 12월 3주, 2017년 1월 1주~2017년 1월 2주, 2017년 1월 4주~2017년 2월 1주, 2017년 2월 3주~2017년 3월 2주, 2017년 4월 3주, 2017년 4월 4주, 2017년 5월 2주~2017년 6월 1주, 2017년 6월 4주, 2017년 7월 2주, 2017년 7월 5주~2017년 8월 1주, 2017년 8월 3주~2017년 8월 4주, 2017년 9월 2주~2017년 9월 4주, 2017년 10월 4주~2017년 12월 2주,2017년 12월 4주~2018년 1월 1주,2018년 1월 4주~2018년 2월 1주,2018년 2월 3주~2018년 3월 4주)
*알라딘 영어독해 베스트셀러 (2015년 4월 4주, 2015년 6월 5주, 2015년 7월 2주~2015년 8월 1주, 2015년 8월 3주~2015년 8월 4주, 2015년 9월 4주~2015년 10월 3주, 2015년 10월 5주~2015년 11월 1주, 2015년 11월 3주, 2015년 11월 5주~2016년 1월 5주, 2016년 2월 2주~2016년 3월 2주, 2016년 3월 4주, 2016년 4월 1주~2016년 4월 4주, 2016년 5월 1주~2016년 5월 3주, 2016년 6월 3주~2016년 6월 4주, 2016년 7월 2주~2016년 8월 1주, 2016년 8월 3주~2016년 8월 4주, 2016년 9월 1주~2016년 10월 1주, 2016년 10월 3주~2016년 10월 5주, 2016년 11월 2주~2016년 11월 4주, 2016년 12월 2주~2016년 12월 3주, 2017년 1월 1주~2017년 1월 2주, 2017년 1월 4주~2017년 2월 1주, 2017년 2월 3주~2017년 3월 2주, 2017년 4월 2주, 2017년 5월 2주~2017년 6월 1주, 2017년 6월 4주, 2017년 7월 2주, 2017년 7월 5주~2017년 8월 1주, 2017년 8월 3주~2017년 8월 4주 ,2017년 9월 2주~2017년 9월 4주, 2017년 10월 4주~2017년 12월 4주,2018년 2월 3주,2018년 3월 1주~2018년 3월 4주) [리스닝 스타트] *알라딘 토플 베스트셀러 (2008년~2013년, 2014년 5월 4주~2014년 6월 2주, 2014년 7월 4주~2014년 8월 1주, 2014년 8월 4주~2014년 9월 2주, 2014년 10월 3주, 2015년 1월 4주, 2015년 5월 2주, 2015년 7월 2주, 2015년 7월 5주~2015년 8월 1주, 2015년 8월 3주~2015년 8월 4주, 2015년 9월 4주~2015년 10월 3주, 2015년 12월 1주, 2015년 12월 5주~2016년 1월 1주, 2016년 1월 4주~2016년 2월 4주, 2016년 3월 3주, 2016년 4월 3주, 2016년 7월 2주, 2017년 8월 4주, 2017년 9월 3주, 2017년 10월 4주, 2017년 11월 3주,2017년 12월 2주,2018년 1월 4주,2018년 2월 1주,2018년 2월 3주,2018년 3월 1주~2018년 3월 4주) *알라딘 영어듣기/말하기 베스트셀러(2015년 5월 2주, 2015년 6월 4주, 2015년 7월 2주, 2015년 8월 1주, 2015년 8월 3주~2015년 8월 4주, 2015년 9월 4주~2015년 10월 3주, 2015년 12월 1주, 2016년 1월 1주, 2016년 1월 4주~2016년 1월 5주, 2016년 2월 2주~2016년 2월 4주, 2016년 3월 3주, 2016년 4월 3주, 2017년 8월 4주, 2017년 9월 3주, 2017년 10월 4주, 2017년 11월 3주,2017년 12월 2주~2017년 12월 3주,2018년 2월 3주~2018년 3월 4주)
[라이팅 스타트2nd] *교보문고 토익토플 베스트셀러 (2017년 5월13일~2017년 5월 19일, 2017년 5월 26일~2017년 6월 29일, 2017년 7월 3일~2017년 7월 8일,2017년 7월 10일~2017년 7월 14일,2017년 7월 16일~2017년 8월 4일,2017년 8월 7일~2017년 9월 15일,2017년 9월 18일~2017년 9월 22일,2017년 9월 23일~2017년 10월 6일~2017년 10월 13일,2017년 10월 14일~2017년 10월 20일,2017년 10월 22일~2017년 10월 27일,2017년 10월 28일,2017년 10월 30일~2017년 11월 3일,2017년 11월 4일~2017년 11월 10일,2017년 11월 11일~2017년 11월 17일,2017년 11월 18일~2017년 11월 20일,2017년 11월 22일~2017년 12월 08일,2017년 12월 9일~2017년 12월 15일,2017년 12월 16일~2017년 12월 22일,2017년 12월 23일~2017년 12월 25일,2017년 12월 27일~2018년 1월 19일,2018년 1월 20일~2018년 1월 26일,2018년 1월 27일,2018년 1월 29일~2018년 2월 2일,2018년 2월 4일~2018년 2월 9일,2018년 2월 11일~2018년 2월 16일,2018년 2월 17일~2018년 3월 2일,2018년 3월 4일~2018년 3월 9일,2018년 3월 10일~2018년 3월 16일,2018년 3월 20일,2018년 3월 22일~2018년 3월 23일,2018년 3월 24일~2018년 3월 30일) [그래머 스타트] *교보문고 토익토플 베스트셀러 (2008년~2013년, 2014년 5월 14일~2014년 6월 3일, 2014년 7월 9일~2014년 7월 15일, 2014년 7월 23일~2014년 7월 29일, 2016년 10월 14일~2017년 1월 6일, 2017년 4월 24일~2017년 7월8일,2017년 7월 10일~2017년 7월 14일,2017년 7월 16일~2017년 8월 4일,2017년 8월 7일~2017년 9월 15일,2017년 9월 18일~2017년 9월 22일,2017년 9월 23일~2017년 10월 6일~2017년 10월 13일,2017년 10월 14일~2017년 10월 20일,2017년 10월 22일~2017년 10월 27일,2017년 10월 28일,2017년 10월 30일~2017년 11월 3일,2017년 11월 4일~2017년 11월 10일,2017년 11월 11일~2017년 11월 17일,2017년 11월 18일~2017년 12월 08일,2017년 12월 9일~2017년 12월 15일,2017년 12월 16일~2017년 12월 22일,2017년 12월 23일~2018년 1월 19일,2018년 1월 20일~2018년 1월 26일,2018년 1월 27일,2018년 1월 29일~2018년 2월 2일,2018년 2월 4일~2018년 2월 9일,2018년 2월 11일~2018년 2월 16일,2018년 2월 17일~2018년 3월 2일,2018년 3월 4일~2018년 3월 9일,2018년 3월 10일~2018년 3월 16일,2018년 3월 18일~2018년 3월 23일,2018년 3월 24일~2018년 3월 30일)
교보문고 외국어 베스트셀러 토플 분야 1위 (2017.01.13, 온라인 주간 집계 기준) [해커스 리딩] *알라딘 토플 베스트셀러 (2008년~2014년 1월 1주, 2014년 1월 3주~2014년 2월 2주, 2014년 2월 4주, 2014년 3월 2주~2014년 4월 4주, 2014년 5월 3주~2014년 5월 4주, 2014년 6월 2주, 2014년 6월 4주~2014년 9월 5주, 2014년 11월 4주~ 2015년 2월 3주, 2015년 3월 2주, 2015년 7월 1주, 2015년 7월 3주, 2015년 7월 5주~2015년 9월 1주, 2015년 10월 2주~2015년 11월 1주, 2015년 11월 3주~2015년 11월 5주, 2015년 12월 2주~2016년 3월 2주, 2016년 3월 5주~2016년 4월 1주, 2016년 4월 3주~2016년 5월 1주, 2016년 5월 3주, 2016년 6월 4주~2016년 7월 3주, 2016년 8월 1주, 2016년 10월 2주, 2016년 11월 1주, 2016년 11월 3주~2016년 12월 1주, 2016년 12월 3주~2017년 1월 1주, 2017년 1월 4주, 2017년 2월 1주, 2017년 2월 3주, 2017년 3월 1주~2017년 3월 2주, 2017년 4월 3주, 2017년 5월 1주,2017년 6월 3주~2017년 8월 1주, 2017년 8월 3주~2017년 8월 4주, 2017년 9월 2주, 2017년 9월 4주, 2017년 10월 4주~2017년 11월 2주,2017년 12월 2주,2017년 12월 4주~2018년 1월 1주,2018년 1월 3주,2018년 1월 5주~2018년 2월 1주,2018년 2월 3주~2018년 3월 4주)
*알라딘 영어독해 베스트셀러 (2015년 6월 5주~7월 1주, 2015년 8월 5주, 2015년 11월 3주, 2015년 11월 5주, 2015년 12월 2주, 2015년 12월 4주~2016년 2월 5주, 2016년 3월 2주, 2016년 4월 1주, 2016년 4월 3주~2016년 5월 1주, 2016년 5월 3주, 2016년 6월 4주~2016년 10월 2주, 2016년 11월 1주, 2016년 11월 3주~2016년 12월 1주, 2016년 12월 3주~2017년 1월 1주, 2017년 1월 4주, 2017년 2월 1주, 2017년 2월 3주, 2017년 3월 1주~2017년 3월 2주, 2017년 5월 1주,2017년 6월 3주~2017년 7월 3주, 2017년 7월 5주~2017년 8월 1주, 2017년 8월 3주~2017년 8월 4주, 2017년 9월 2주, 2017년 9월 4주, 2017년 10월 4주~2017년 11월 2주,2017년 12월 1주,2017년 12월 4주,2018년 1월 3주,2018년 2월 3주~2018년 3월 4주) [해커스 리스닝] *알라딘 토플 베스트셀러 (2008년~2012년, 2014년 6월 2주, 2014년 7월 5주~2014년 8월 1주,2014년 9월 3주, 2014년 10월 3주, 2014년 12월 2주~2015년 2월 1주, 2015년 3월 4주, 2015년 6월 2주, 2015년 7월 2주, 2015년 8월 2주, 2015년 9월 1주, 2015년 9월 4주~2015년 10월 2주, 2015년 10월 4주, 2016년 1월 1주~2016년 1월 2주, 2016년 2월 4주~2016년 2월 5주, 2016년 5월 3주, 2016년 7월 1주~2016년 7월 2주, 2016년 8월 1주, 2016년 8월 5주~2016년 9월 1주, 2016년 10월 1주~2016년 10월 3주, 2016년 10월 5주, 2017년 1월 4주, 2017년 3월 1주, 2017년 4월 2주,2017년 5월 4주~2017년 5월 5주, 2017년 7월 1주~2017년 7월 2주, 2017년 10월 2주,2017년 12월 2주,2018년 2월 1주,2018년 2월 4주~2018년 3월 1주,2018년 3월 3주~2018년 3월 4주)
알라딘 영어듣기/말하기 베스트셀러 (2015년 6월 2주, 2015년 7월 2주, 2015년 8월 2주~ 2015년 8월 3주, 2015년 9월 1주, 2015년 9월 4주~2015년 9월 5주, 2015년 10월 2주, 2015년 10월 4주, 2016년 1월 1주~2016년 1월 2주, 2016년 2월 4주~2016년 2월 5주, 2016년 5월 3주, 2016년 7월 2주~2016년 7월 2주, 2016년 8월 1주, 2016년 8월 5주~2016년 9월 1주, 2016년 9월 4주, 2016년 10월 3주, 2017년 1월 4주, 2017년 3월 1주, 2017년 4월 2주,2017년 5월 4주~2017년 5월 5주,2017년 7월 1주~2017년 7월 2주, 2017년 10월 2주) [해커스 그래머] *교보문고 토익토플 베스트셀러 (2017년 5월22일~2017년 6월 21일,2017년 6월 23일~2017년 7월 8일,2017년 7월 10일~2017년 7월 14일,2017년 7월 16일~2017년 8월 4일,2017년 8월 7일~2017년 9월 15일,2017년 9월 18일~2017년 9월 22일,2017년 9월 23일~2017년 10월 6일, 2017년 10월 8일~2017년 10월 13일,2017년 10월 14일~2017년 10월 20일,2017년 10월 22일~2017년 10월 27일,2017년 10월 28일,2017년 10월 30일~2017년 11월 3일,2017년 11월 4일~2017년 11월 10일,2017년 11월 11일~2017년 11월 17일,2017년 11월 18일~2017년 12월 08일2017년 12월 09일~2017년 12월 10일,2017년 12월 15일,2017년 12월 16일~2017년 12월 22일,2017년 12월 23~2018년 1월 19일,2018년 1월 20일~2018년 1월 26일,2018년 1월 27일,2018년 1월 29일~2018년 2월 2일,2018년 2월 4일~2018년 2월 9일,2018년 2월 11일~2018년 2월 16일,2018년 2월 17일~2018년 3월 2일,2018년 3월 4일~2018년 3월 9일,2018년 3월 10일~2018년 3월 16일,2018년 3월 18일~2018년 3월 23일,2018년 3월 24일~2018년 3월 30일)
*교보문고 외국어 베스트셀러 (2017년 12월 02일~2017년 12월 03일,2017년 12월 05일~2017년 12월 08일) [수퍼 보카] *YES24 국어/외국어 사전 영어-영어 어휘/Vocabulary 분야 베스트셀러 (2008년~2015년 7월, 2015년 10월~2016년 1월, 2016년 3월~2016년 4월, 2016년 6월, 2016년 9월~2017년 1월, 2017년 3월~2017년 4월, 2017년 5월 2주~2017년 6월 4주,2017년 7월 4주~2017년 7월 5주,2017년 8월 2주~2017년 8월 4주,2017년 9월 2주,2017년 9월 4주~2017년 10월 3주,2017년 11월 1주,2017년 11월 3주~2017년 12월 1주,2017년 12월 3주~2017년 12월 4주,2018년 1월 2주~2018년 1월 3주,2018년 1월 5주~2018년 2월 2주,2018년 2월 4주~2018년 3월 2주,2018년 3월 4주)


 불편사항 신고