


 인쇄
인쇄


Sedack
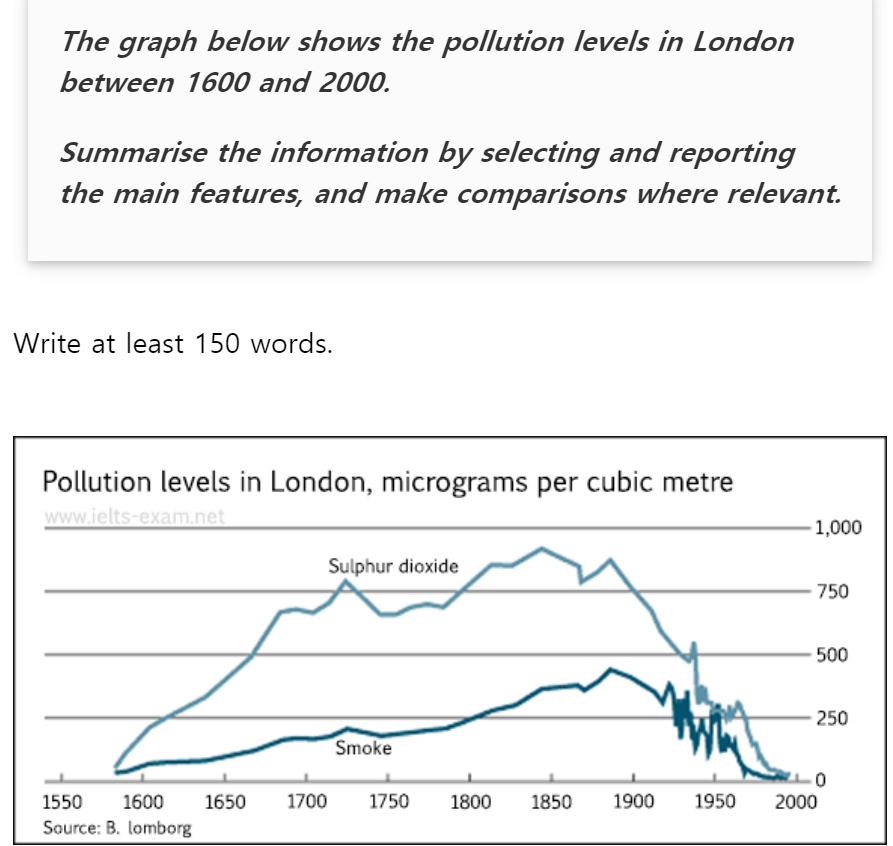
The line graph illustrates the pollution levels of sulphur dioxide and smoke in London between 1600 and 2000.
Overall, the level of surphur dioxide was higher than the one of smoke in all years except 1950, but they had a similar flow.
Looking at the graph more closely, in 1600, both amounts of pollution were less than 250 micrograms per cubic meter respectively. After than, the levels of sulphur dioxide and smoke had been gradually increasing with occasional little drops, and reached a peak by roughly 900 micrograms per cubic meter in about 1850 and 400 micrograms per cubic meter in about 1890 each. Between 1900 and 2000, there was frequent fluctuations in the levels of both pollution. At this period, once, the amount of emitted smoke exceeded the one of sulphur dioxide in 1950 at about 300 micrograms per cubic meter. The fluctuations was going to decrease ,so in 2000, both levels reached at 0.

 댓글 0개
댓글 0개


 불편사항 신고