


 인쇄
인쇄


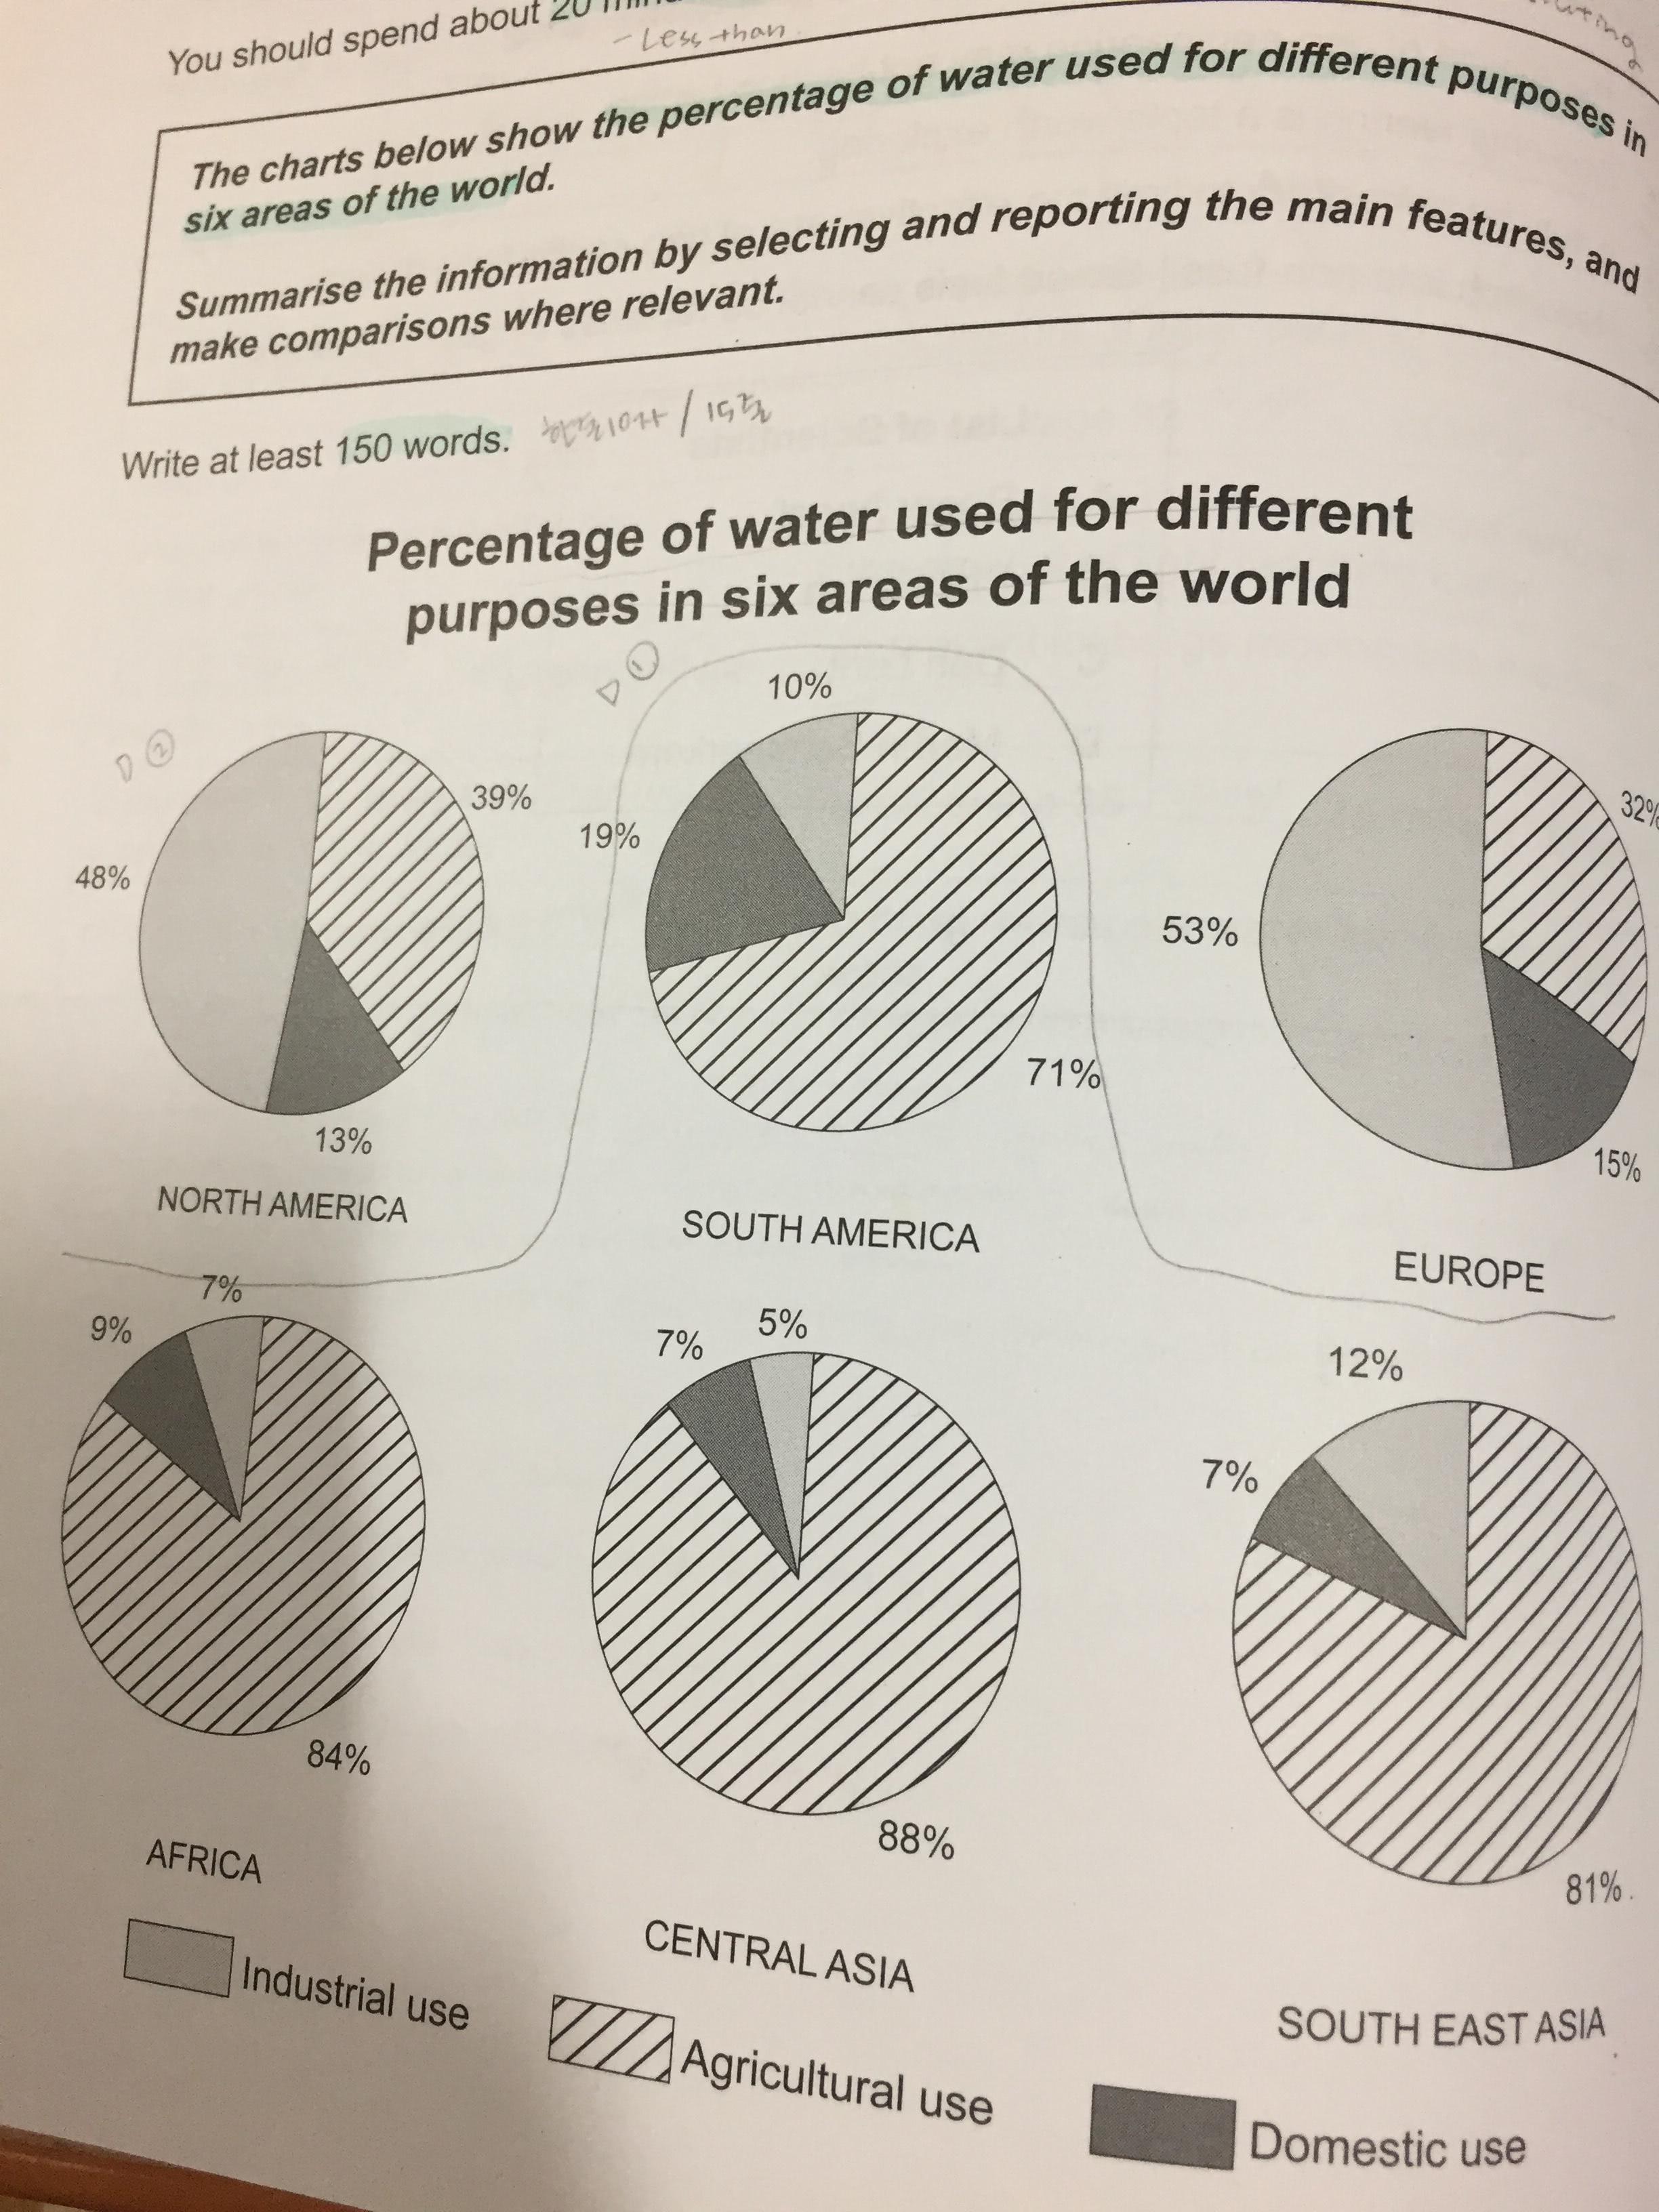
The pie charts depict the information about proportion of water consumption for industry, agriculture and domestics in North America, South America, Europe, Africa, Central Asia and South East Asia. (절대 절대 절대 절대 절대 나열하지 마시고, 이 시간조차 아까우니까 그 시간에 밑에 overview 랑 세부적인 분석을 하는데 집중해주세요! 여기는 그냥 six areas of the world 이런 식으로 퉁치고 넘어가면 됩니다. 지금처럼 나열하는 건 분량 채우기에 지나지 않아요.) South America, Africa, Central Asia and South East Asia consume water for agriculture the most (이게 있고 없고는 천지차이입니다.) and The the proportion of industrial use represent about half of the total usage in North~~ in North Ameirca and Europe represent about a half of industrial use.
Turning to the details, the proportion in South East Asia., South America, Africa, Central Asia and South East Asia is dominated by/from agricultural use, accounting for over 70%. The industrial and domestic consumption is marginal (좋습니다.). The four countries for domestics Domestic usages for the four regions (참고로 나라가 아닙니다.) constitute from 7% to 12%. The industrial consumption of four countries is at least 5% and at maximum 12%.
Meanwhile, North America and Europe use the most water for industry, which takes up 48% and 53% respectively. This followed by agricultural consumption which is 39% and 32%. The proportion of domestic consumption is minimal, showing 13% and 15%.
총평: (5/6/7/6) 6.0
채점관에 따라 6.5까지는 어찌저찌 갈 수 있겠으나, 그 이상 가려면 내용에서의 추가적인 분석이 필요합니다. 가령 위에서 네 개의 대륙을 하나로 묶은 것까지는 좋은데, 이 친구들은 공통점도 있지만 차이점 역시 있습니다. 동남아가 나머지 세 지역과 차별화를 보이는데, 그것을 작성할 수 있어야 하고요. 이런 식의 살 붙이기를, 서론에서 무의미하게 항목 나열하는 것보다 훨씬 우선시해주셔야 합니다. 수고하셨습니다 :)

 비밀번호 확인
 댓글 0개
댓글 0개


 불편사항 신고