


 인쇄
인쇄


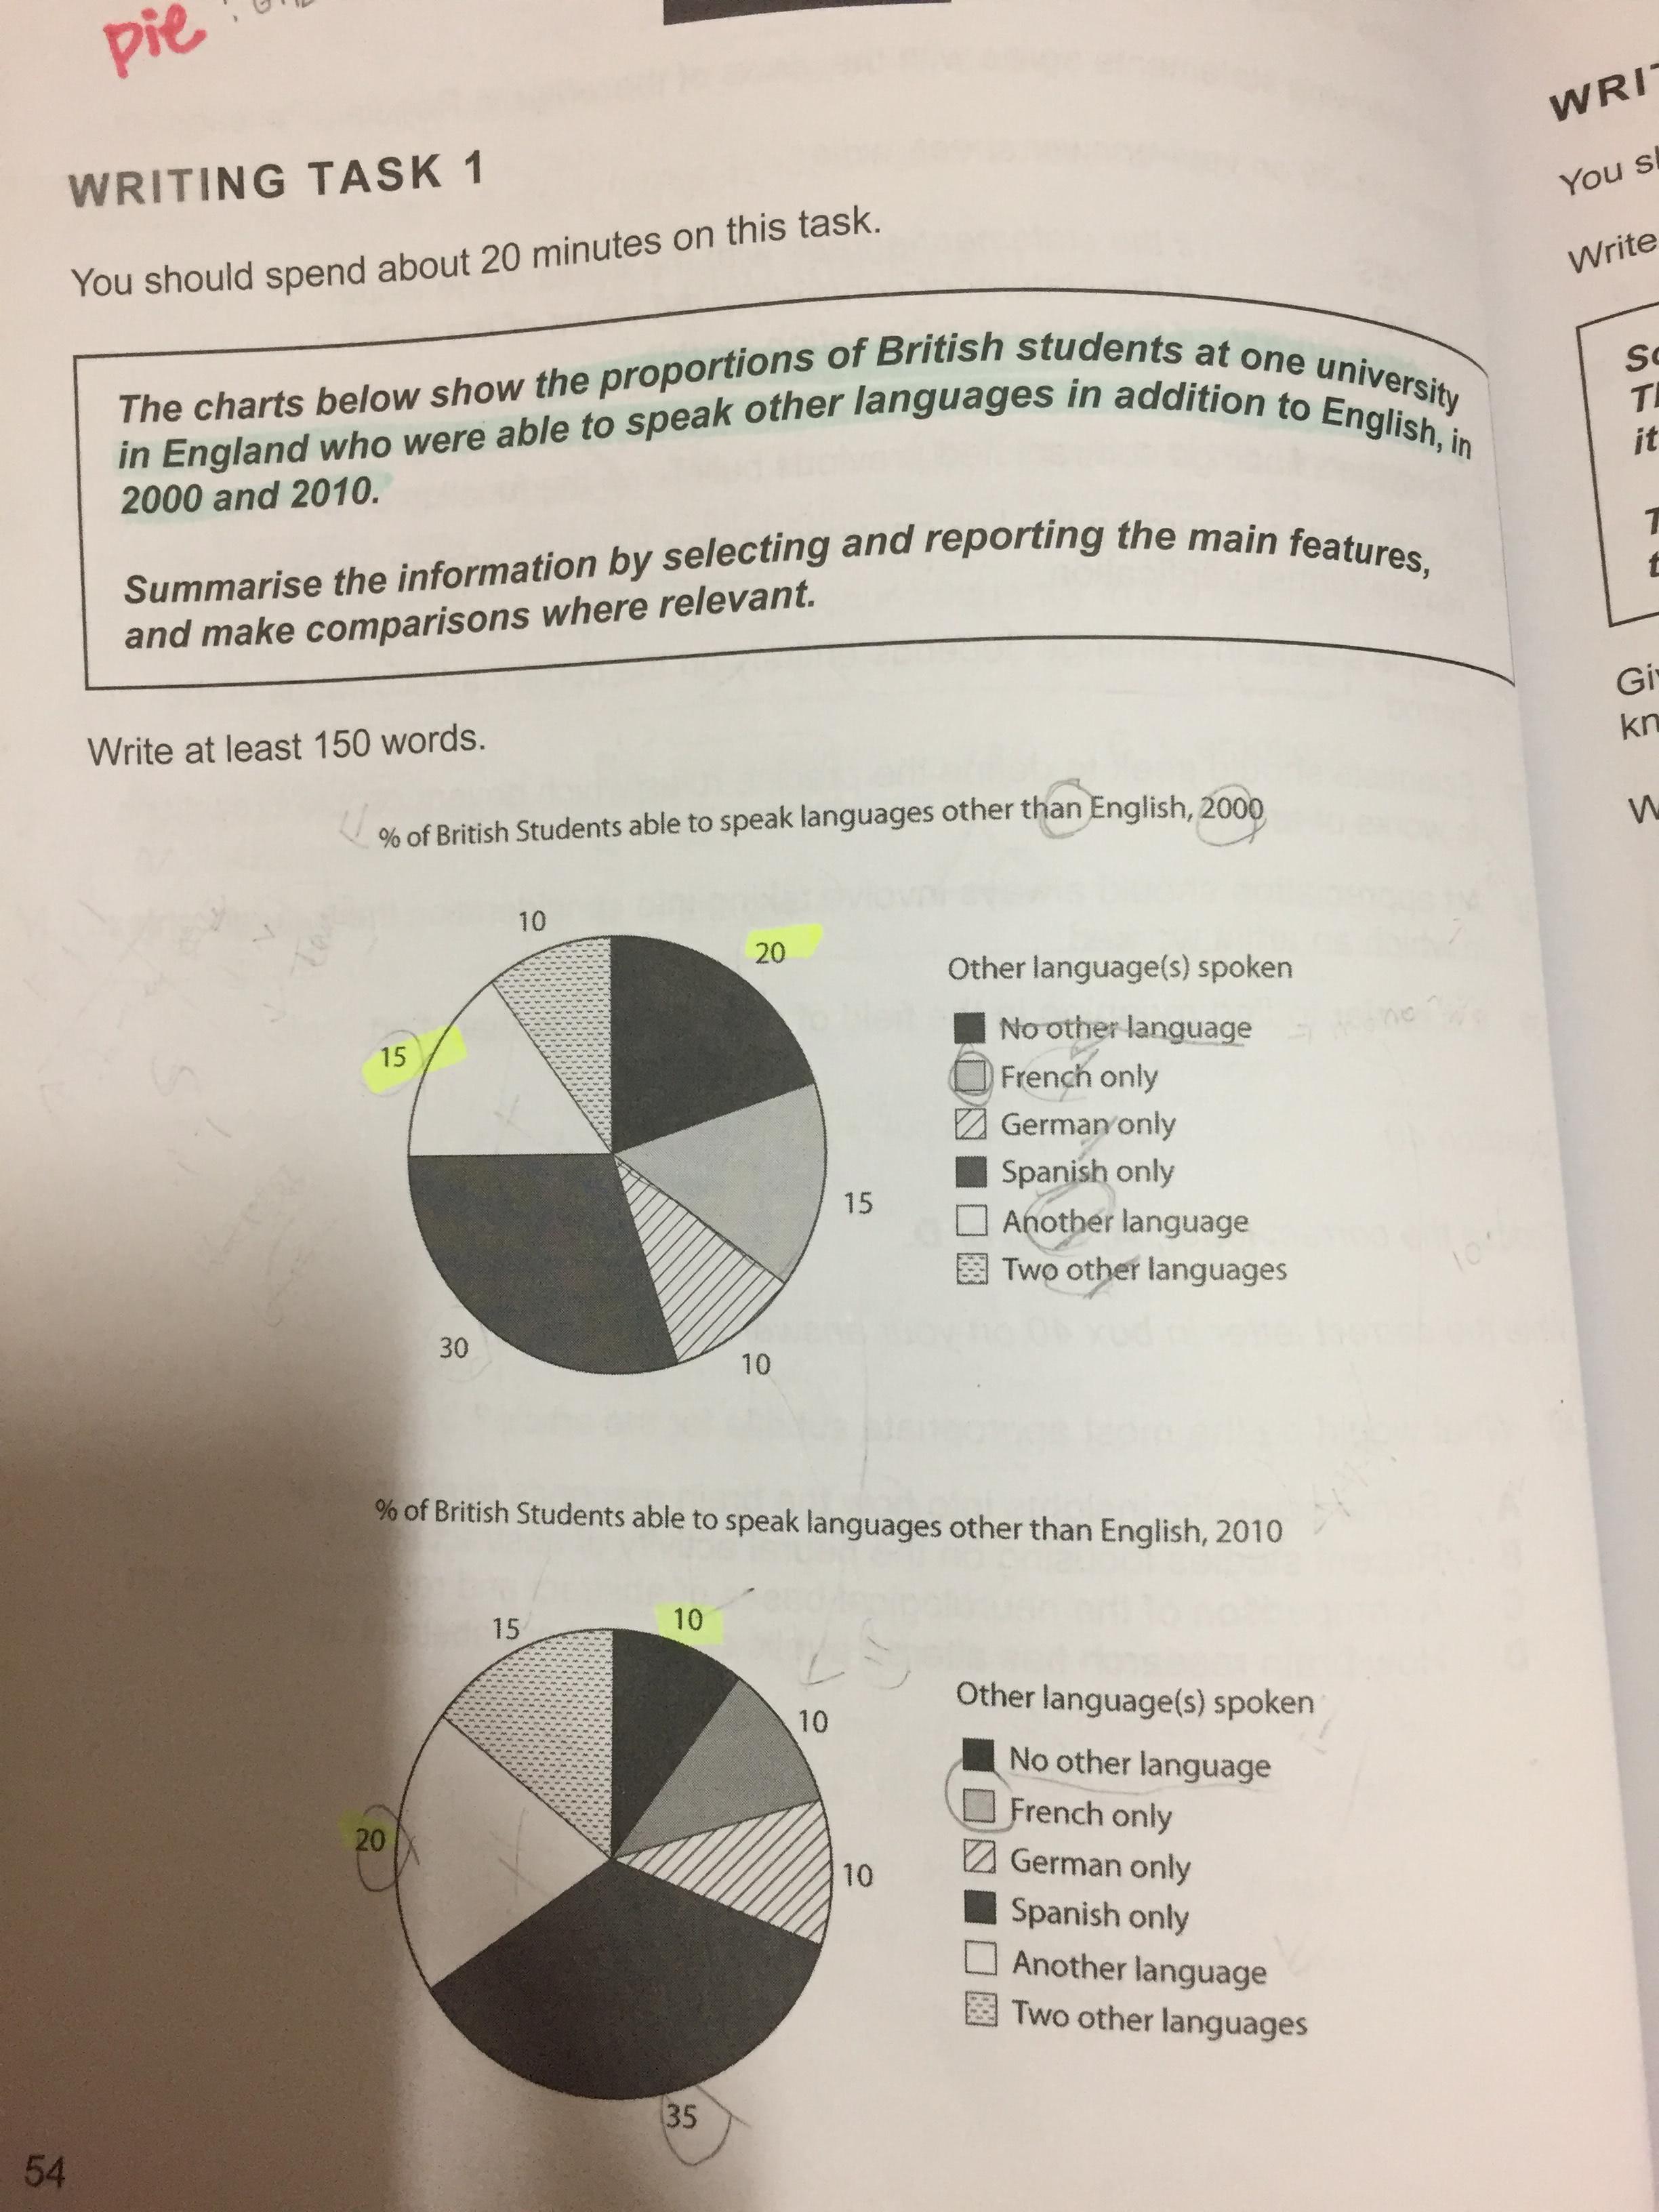
The pie charts illustrate the records about the percentages that learners at the specific college in British could speak various languages apart from including English in the year 2000 and 2010. (일단은 <---이 문장 잘 써주셨는데, 노파심에 한 가지 말씀드리자면 task 1의 서론은 제일 중요도가 떨어지니까, 서론을 패러프레이징을 할 때 다른 표에서도, 분석이나 overview 작성에 지장이 가지 않는 선에서 잘 조절해주세요!) In general, when the time was the year 2010, the percentage of learners who could not speak language reduced. (이거 진짜 생각보다 치명적으로 작용합니다. overview 에서 틀리는 순간 TR에서 7점 이상 받는 것은 거의 물건너간다고 보시면 돼요. '외국어' 가 꼭 들어가도록 해주세요!)
Turning to the details, in 2000, the largest percentage was Spanish only, taking up 30%. This followed by students who could not communicate with languages was one-fifth. (여기도 마찬가지입니다.) The percentages of bilingual and French only represented same figure, 15%. The percentages of German only and multilingual were marginal, accounting for 10%.
Meanwhile, learners who could not speak by using languages in 2000 declined by 10% points (여기도 마찬가지이고요. 표의 no other 는 영어를 제외한 언어입니다. 즉, 영어는 기본적으로 하는 친구들의 비율이에요.) which constituted the biggest difference in the list. The increased 5% points made up those who were (bilingual 자체는 언어가 아닙니다.) spoke bilingual and multilingual, while learners spoken French only decreased 5% points from 15% to 10%. Interestingly, the percentage of German only maintained 10% equally in 2000 and in 2010.
총평: (5/6/6/7) 6.0
문법이 깔끔했는데 갑자기 내용에서 엉뚱한 문제가 생겨서 너무 아쉽네요. 저것만 잘 됐어도 6.5는 당연하고 7.0도 충분히 가능했어보였는데... 여하튼 no other language 관련해서 표시해드린 세 부분은 정말 큰 영향을 끼치니 주의해주시고, Percentage 의 경우 동의어가 정말 많습니다. 이를 잘 활용해서 작성해주세요! 수고하셨습니다 :)

 비밀번호 확인
 댓글 0개
댓글 0개


 불편사항 신고