


 인쇄
인쇄


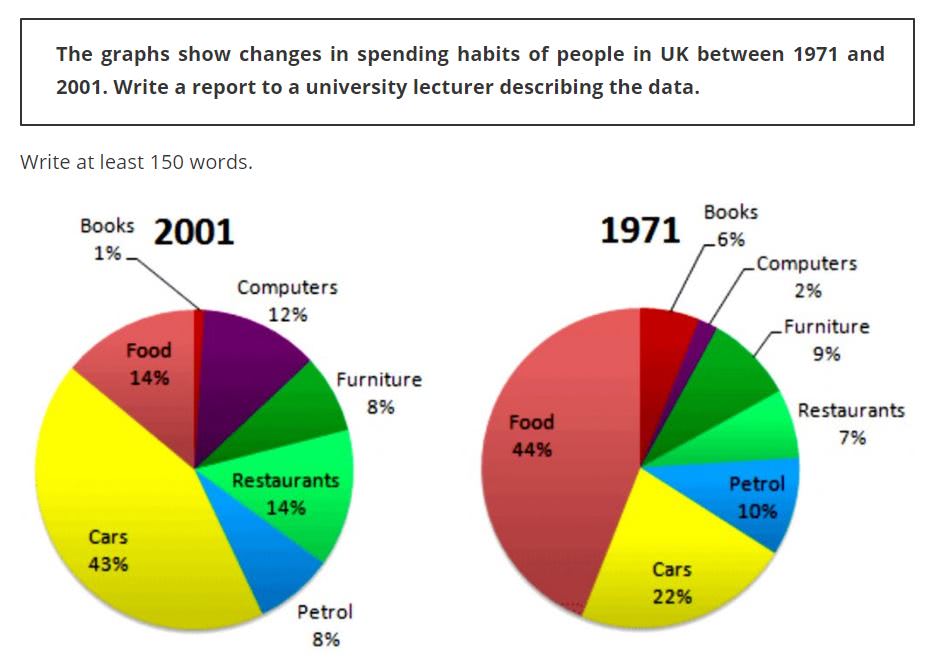
The given graphs illustrate the preference of seven different goods
based on the expenditure from people in the UK between 1971 and 2001.
Overall,
it is clear that the most preferable products that people in the UK tend to
spend money had been changed from cars to foods.
Looking
at the graph in more detail, in 1971, 44 percent of expenditure was consumed to
purchase foods followed by cars with 22 percent. However, the percentage of spending
for computer items was the lowest with only 2 percent. Meanwhile, other figures
in 1971 was varied from 6 percent to 10 percent.
When
it comes to the figures in 2001, people spent more money (돈의 양 자체가 늘었는지는 이 표만 봤을 때 알 수 없습니다. 물론, 물가 상승이 있었을테니까 돈 양은 무조건 늘긴 했겠죠. 그래도 표 내에서는 비율로만 봐주셔야합니다. 즉, 더 많은 비율의 돈을~로 적어주셔야해요.) to buy items for cars
with 43 percent which was around doubled compared to that for 1971. (연결어 사용을 무조건적으로 권장드리지는 않지만, 그래도 여기 정도는 연결어가 됐든 다른 방법이 됐든 조금 더 매끄럽게 이어주세요! 대신 밑에서도 말씀드리겠지만 다른데에는 연결어를 조금 줄이는 게 좋긴 합니다.)) The figure
for foods showed a significant drop of as 30 percent points. The percentage of
expenditure in restaurants and computers rose to 14 percent and 12 percent
respectively. In contrast, spending to purchase petrol and furniture had
dropped to the same rate, 8 percent. Meanwhile, people spent the least money to
buy books with only 1 percent.
총평: (7/6/7/7) 7.0
잘 적어주시긴 했는데, 문법이 그렇게 다양한 편은 아닙니다. 정확성은 어느정도 확보된 상황이니까 이제 다양성에만 조금 더 신경써주시면 좋을 것 같아요. (물론 이정도만 되도 6.5는 문제없이 넘깁니다.)
또한 6.5 선에서 크게 중요한 것은 아니지만, 과한 연결어 사용 역시 8점 이상 나아가는데에 발목을 잡는 요인이 됩니다. 실제로 모범답안들 보시면 연결어 사용이 거의 없는 경우가 대부분이니까, 혹시 7.5 이상이 욕심나신다면 이쪽도 조금 더 신경써주세요~수고하셨습니다 :)

 비밀번호 확인
 댓글 0개
댓글 0개


 불편사항 신고