


 인쇄
인쇄


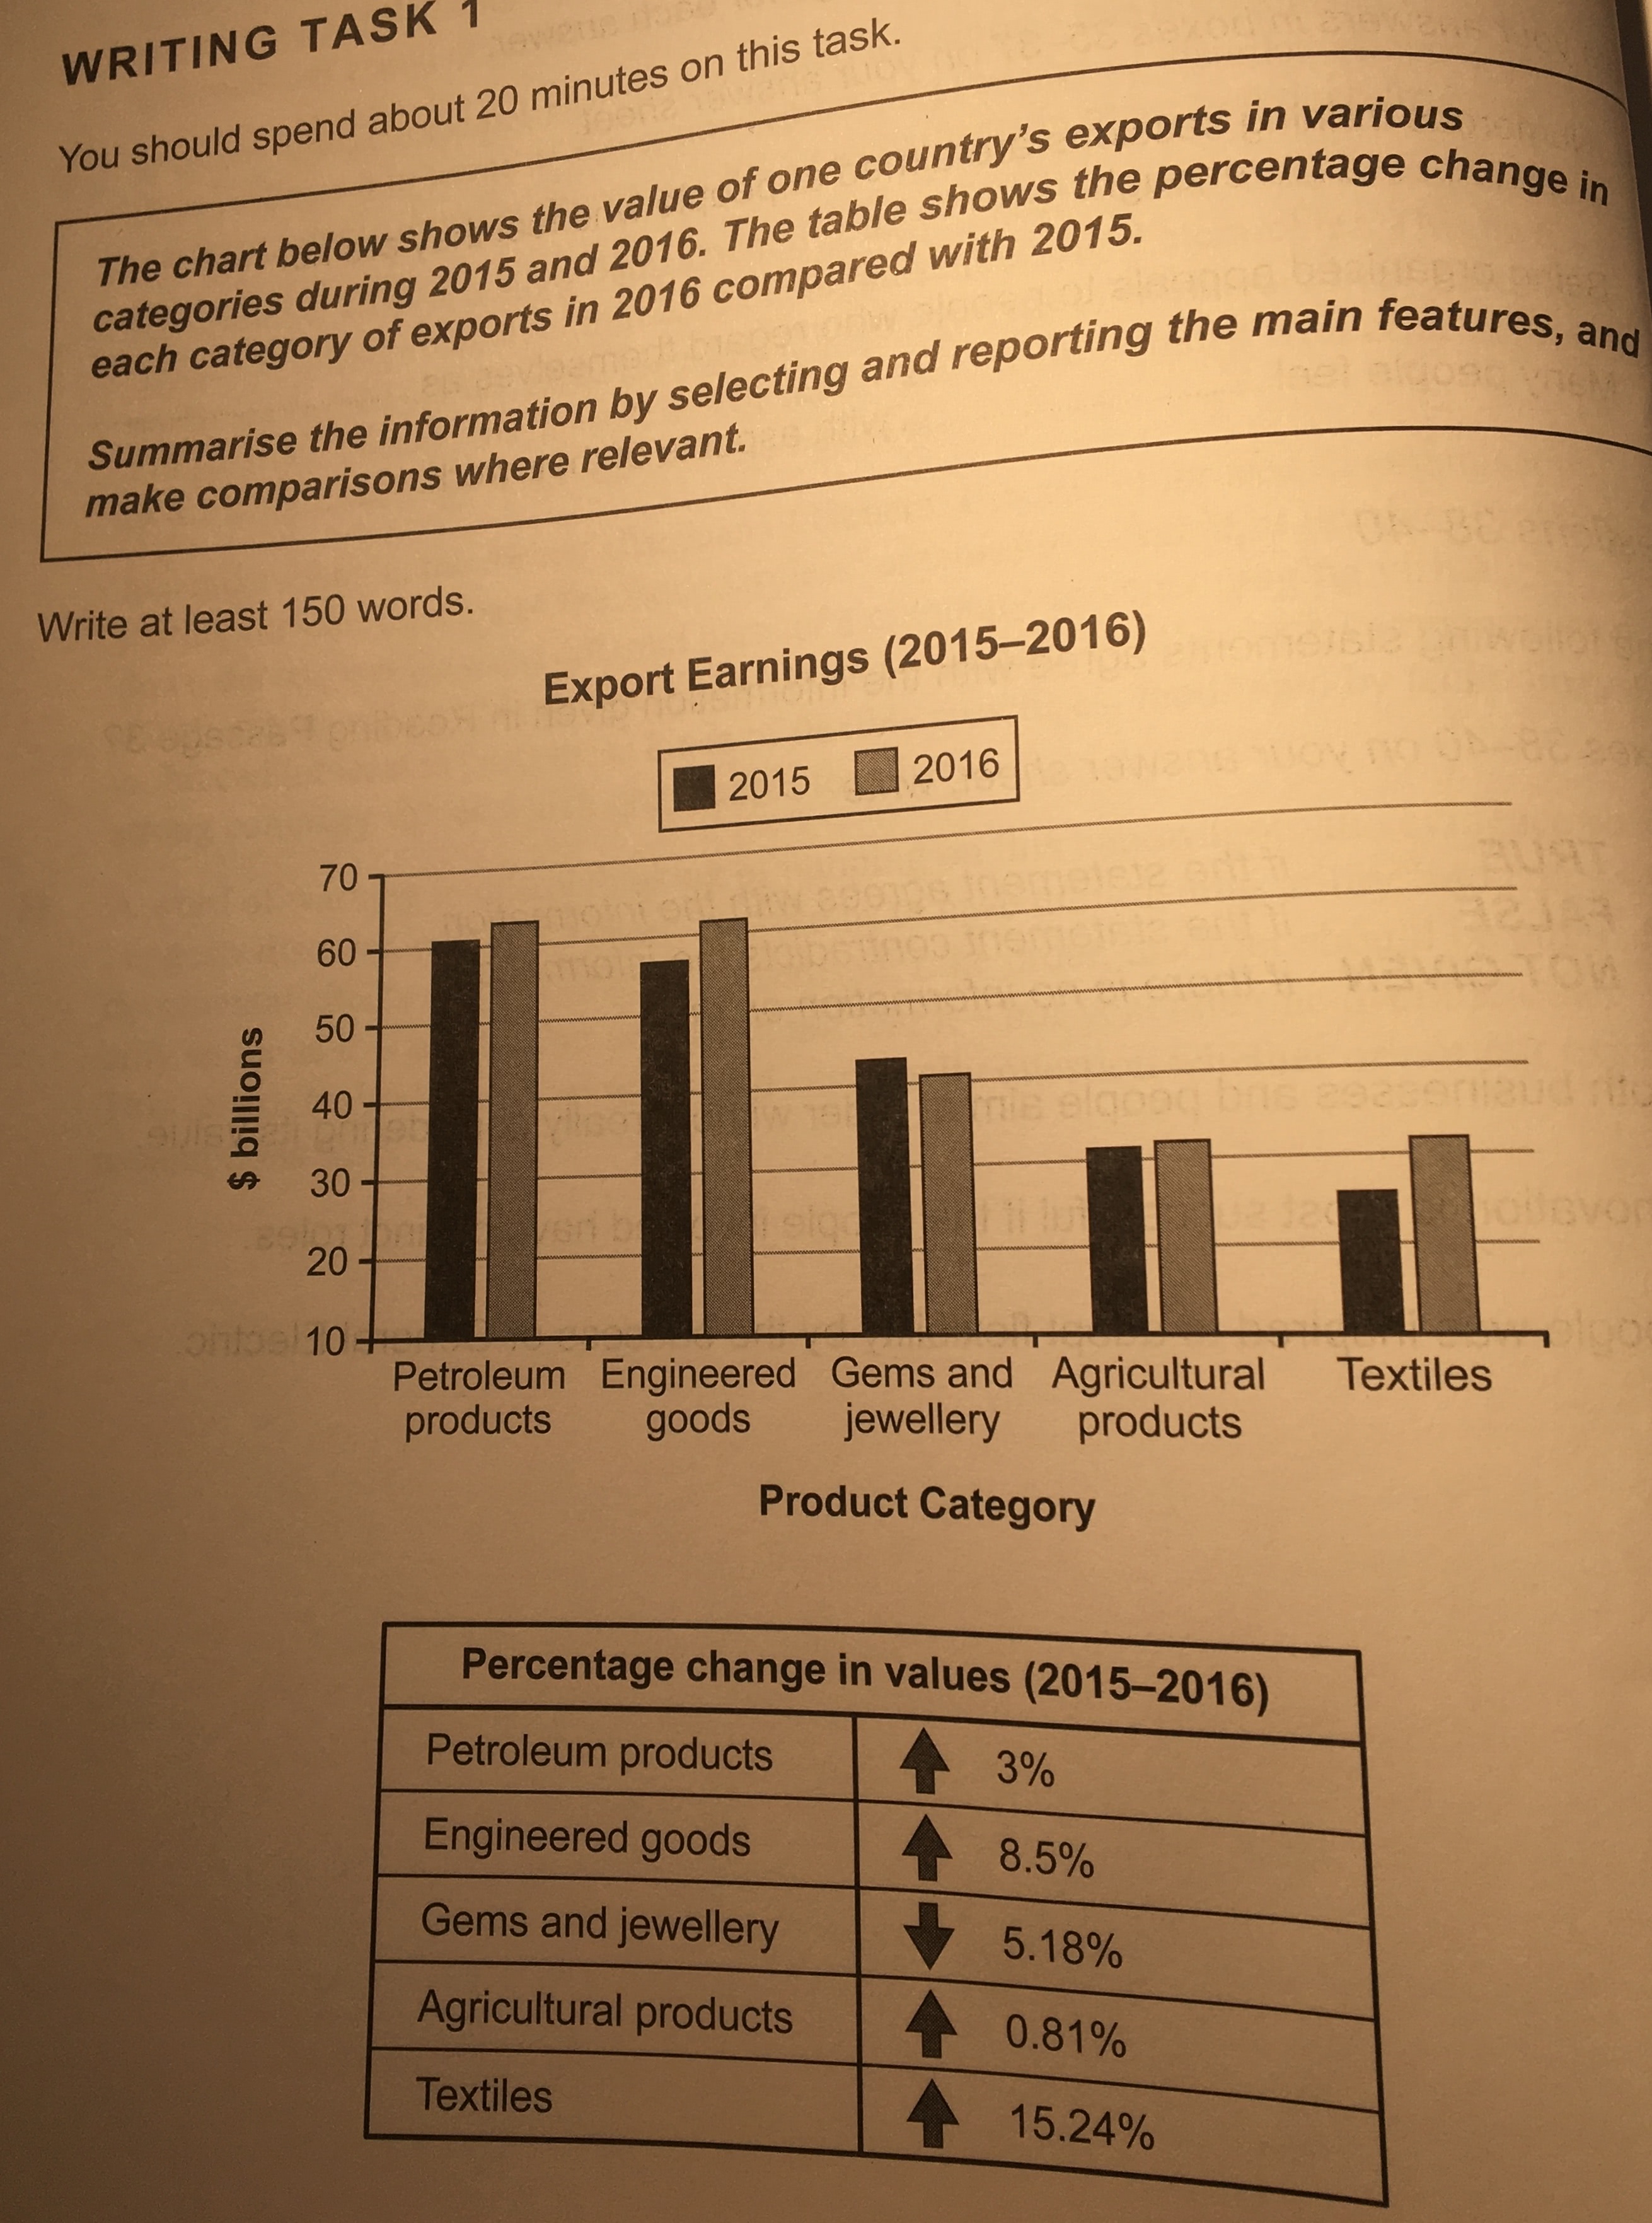
The bar graph indicates the value of one
country’s export in variety of categories from 2015 to 2016, and the table
shows the proportion changes in five categories of exports between 2015 to
2016.
According to the first graph, it is clear that
amount of export earnings of all of the categories except for gems and
jewellery, which is increased in between 2015 and 2016. In 2015, one the country exported petroleum
products the most. However In contrast (한국어로 '그러나' 와 '이와 반대로' 를 대입해보시면 어떤 차이인지 금방 파악하실 수 있을 겁니다.), it earned the lowest amount of money by selling of textiles. In 2016, the same country also made the
most money with the petroleum products. In addition, the figure of the agricultural
products and textiles were once again the biggest, among the given
categories.
In the second graph, it is apparent that the value of the each category increased except for the worth of gems and jewellery. The proportion of values of textiles was changed the most between 2015 and 2016, by 15.24 percent. In contrast, the worth of agricultural products increased only 0.81 percent over this period.
총평: (5/6/7/6) 6.0
어휘는 깔끔했고, 문법의 경우도 비슷한 문장들이 종종 보이긴 했으나 최소한 오류는 거의 없었습니다. 그러나 이에 비해 내용상으로는 아쉬웠고요. 일단 task 1에서는 overview 가 없을 경우, 아무리 세부적인 분석이 잘 되었다고 하더라도 TR에서 5점, 아주 잘 쳐줘야 6점을 넘기기 어렵습니다. 그러니까 본격적인 분석에 들어가기 전에 서론 밑에 따로 문단을 빼서 두 표가 보여주는 바를 포괄적으로 요약해주세요!
그 이후 세부적인 분석에서는 구체적인 수치를 언급하면서 작성해주시면 됩니다. 그러나 현재 마지막 두 문단에 구체적인 수치라고는 15.24와 0.81이 다이므로, 더 넣어주셔야겠고요. 수고하셨습니다 :)

 비밀번호 확인
 댓글 0개
댓글 0개


 불편사항 신고