


 인쇄
인쇄


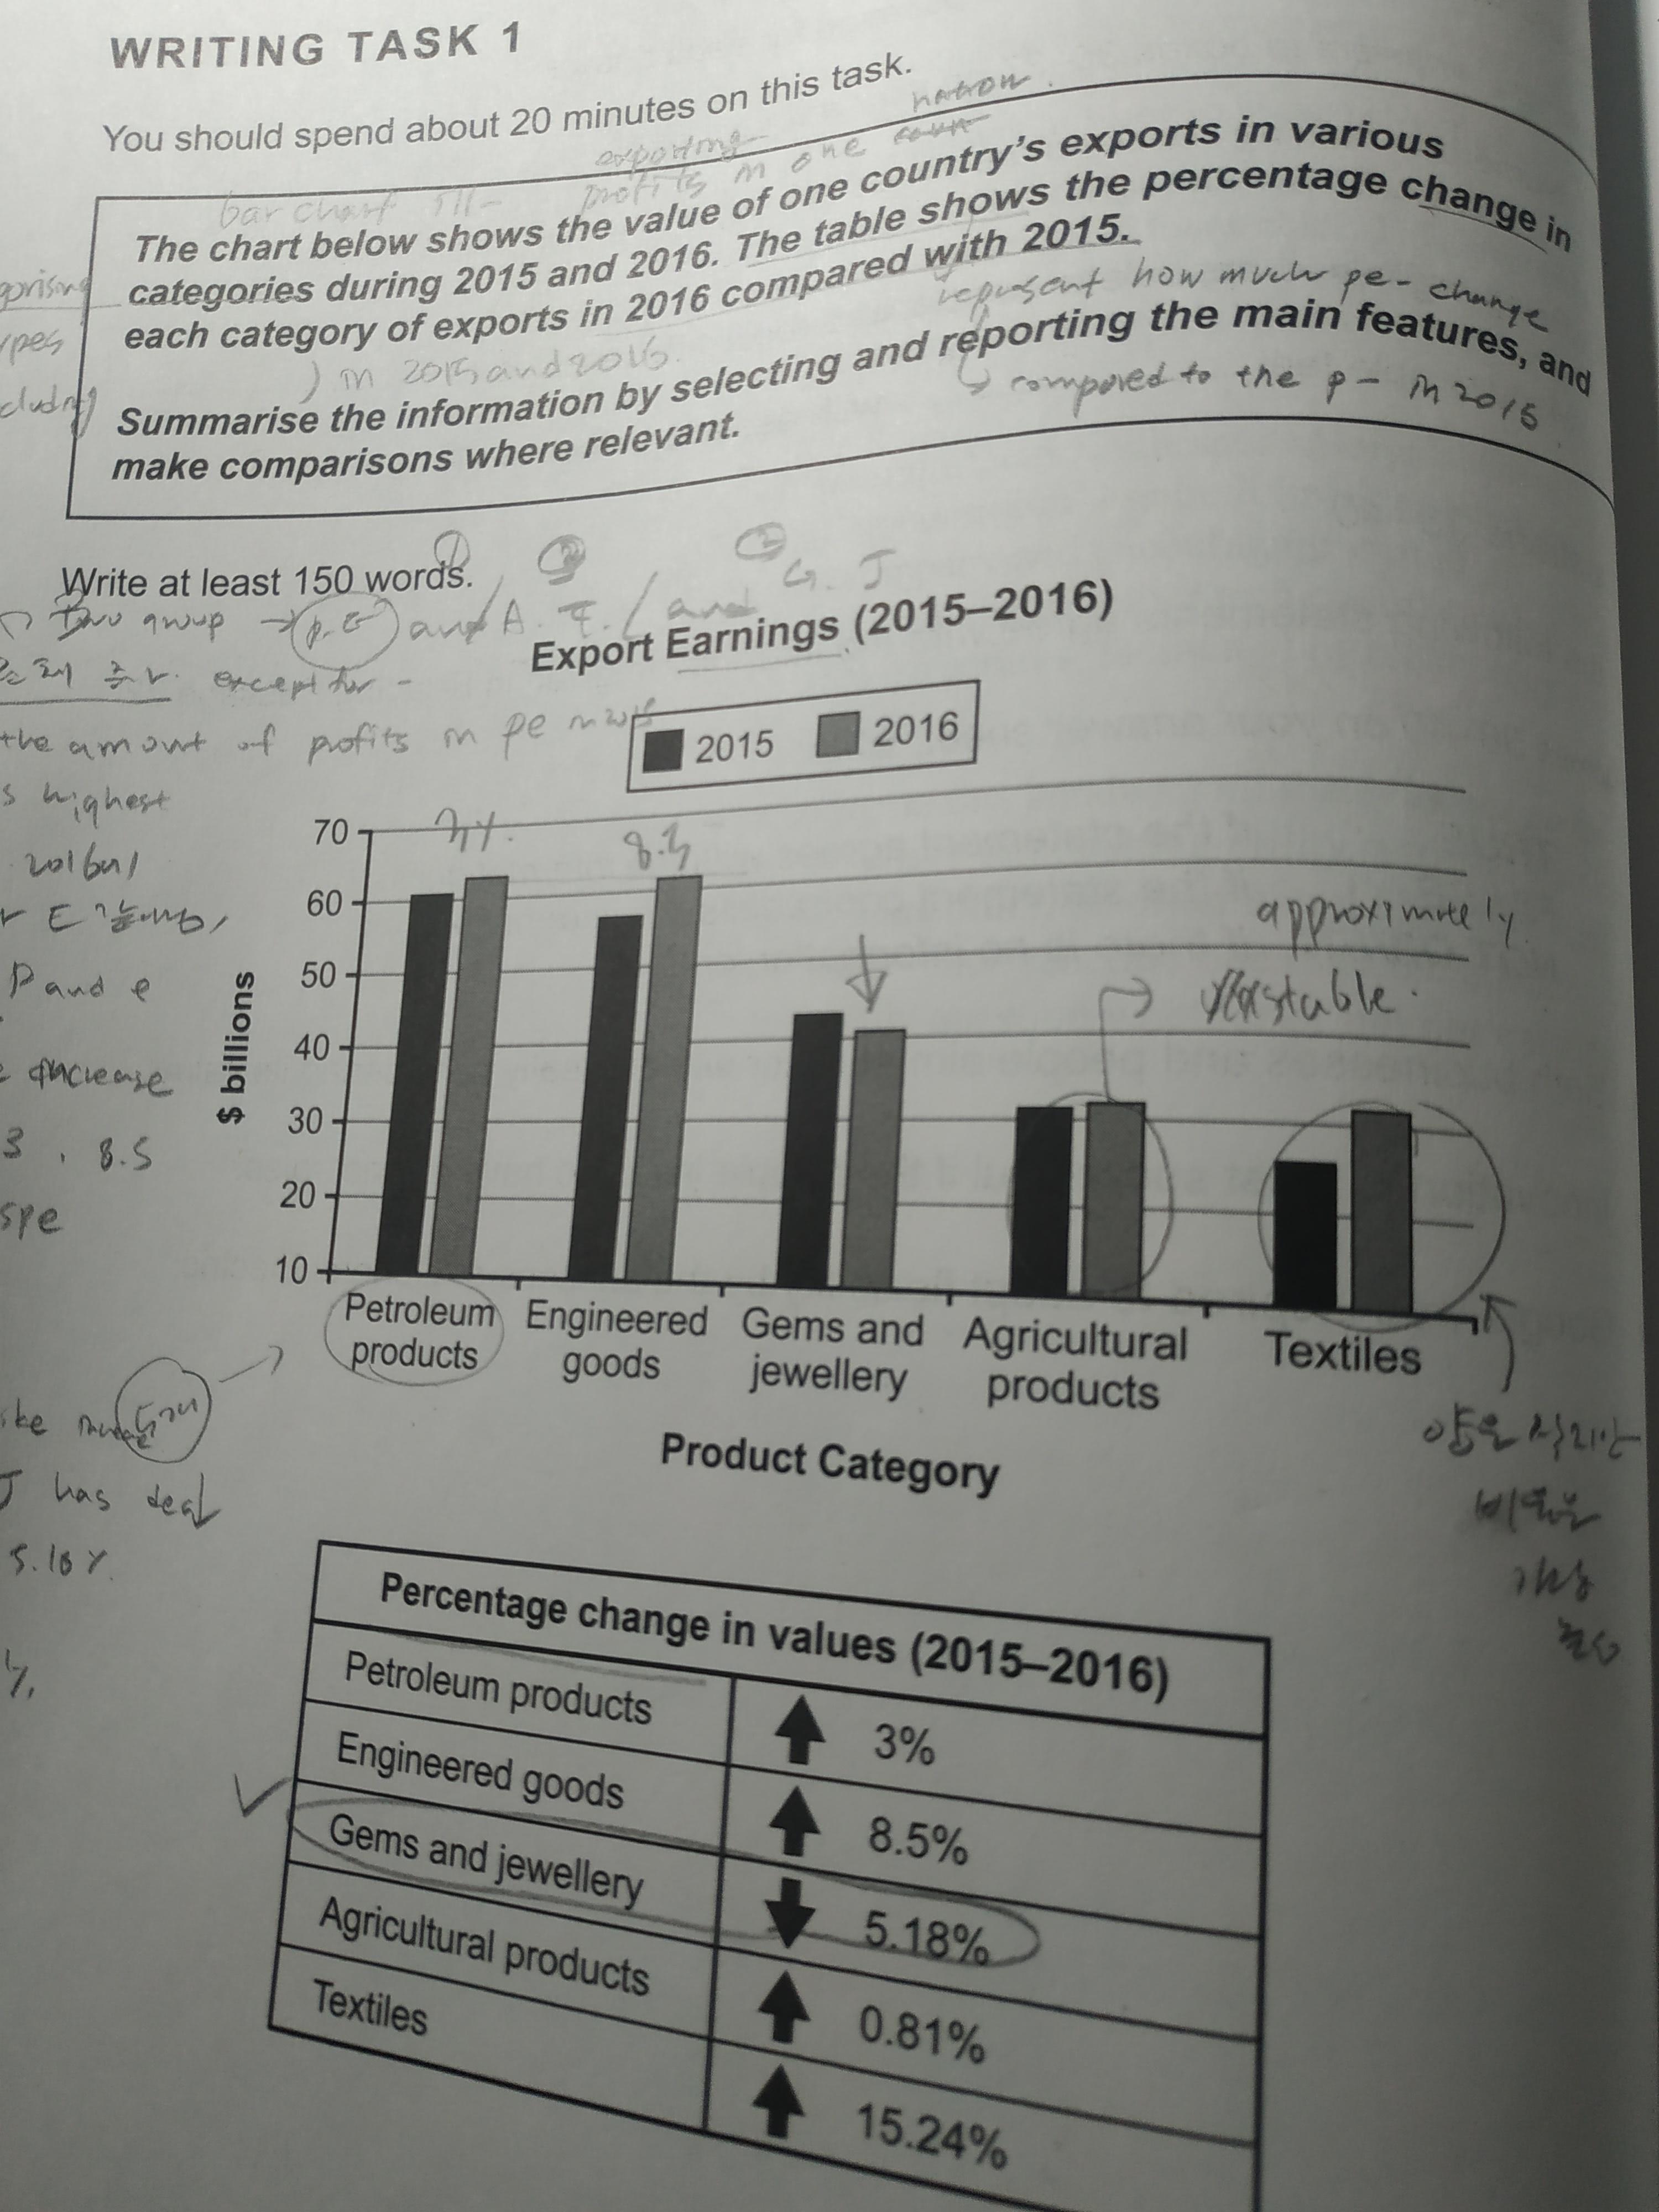
The bar chart illustrates the exporting
profits in one nation categorizing five types of industry, including petroleum
products, engineered goods, gems and jewellery, agricultural products and
textiles in 2015 and 2016. The table represents how much the percentages change in the respective categories in 2016 compared to earning in 2015.
Overall, there are three groups. The first
group has the highest profits during the period shown in the bar chart, which
are petroleum products and engineered goods. The second group has the lowest in earning, which are agricultural product and textile. Finally, the last group includes
gems and jewellery that only show a decline in the profits.
In the first group, the amount of profits
in petroleum types is higher than the other in 2015, with 60 billion dollars
and 56 billion dollars respectively. However, in 2016, due to the increasing at
8.5 % of earning, the engineered goods show the most prospective category in
2016. On the other hand, petroleum products increase just 3%.
In the second group, agricultural products
do not change at the profits. On the other hand, the value in textiles soared
from 26 billion dollars up to 31 billion dollars in 2016, which is the most
increasing percentages in the nation, even if it has the lowest amount of
money ranging from 25 billion dollars to 31 billion dollars.
In the third group, the gems and jewellery
don’t show any dramatic changes during the time shown in the bar chart.
However, it is the only department that the profits slightly declined from 42
billion dollars to 41 billion dollars.

 댓글 0개
댓글 0개


 불편사항 신고