


 인쇄
인쇄


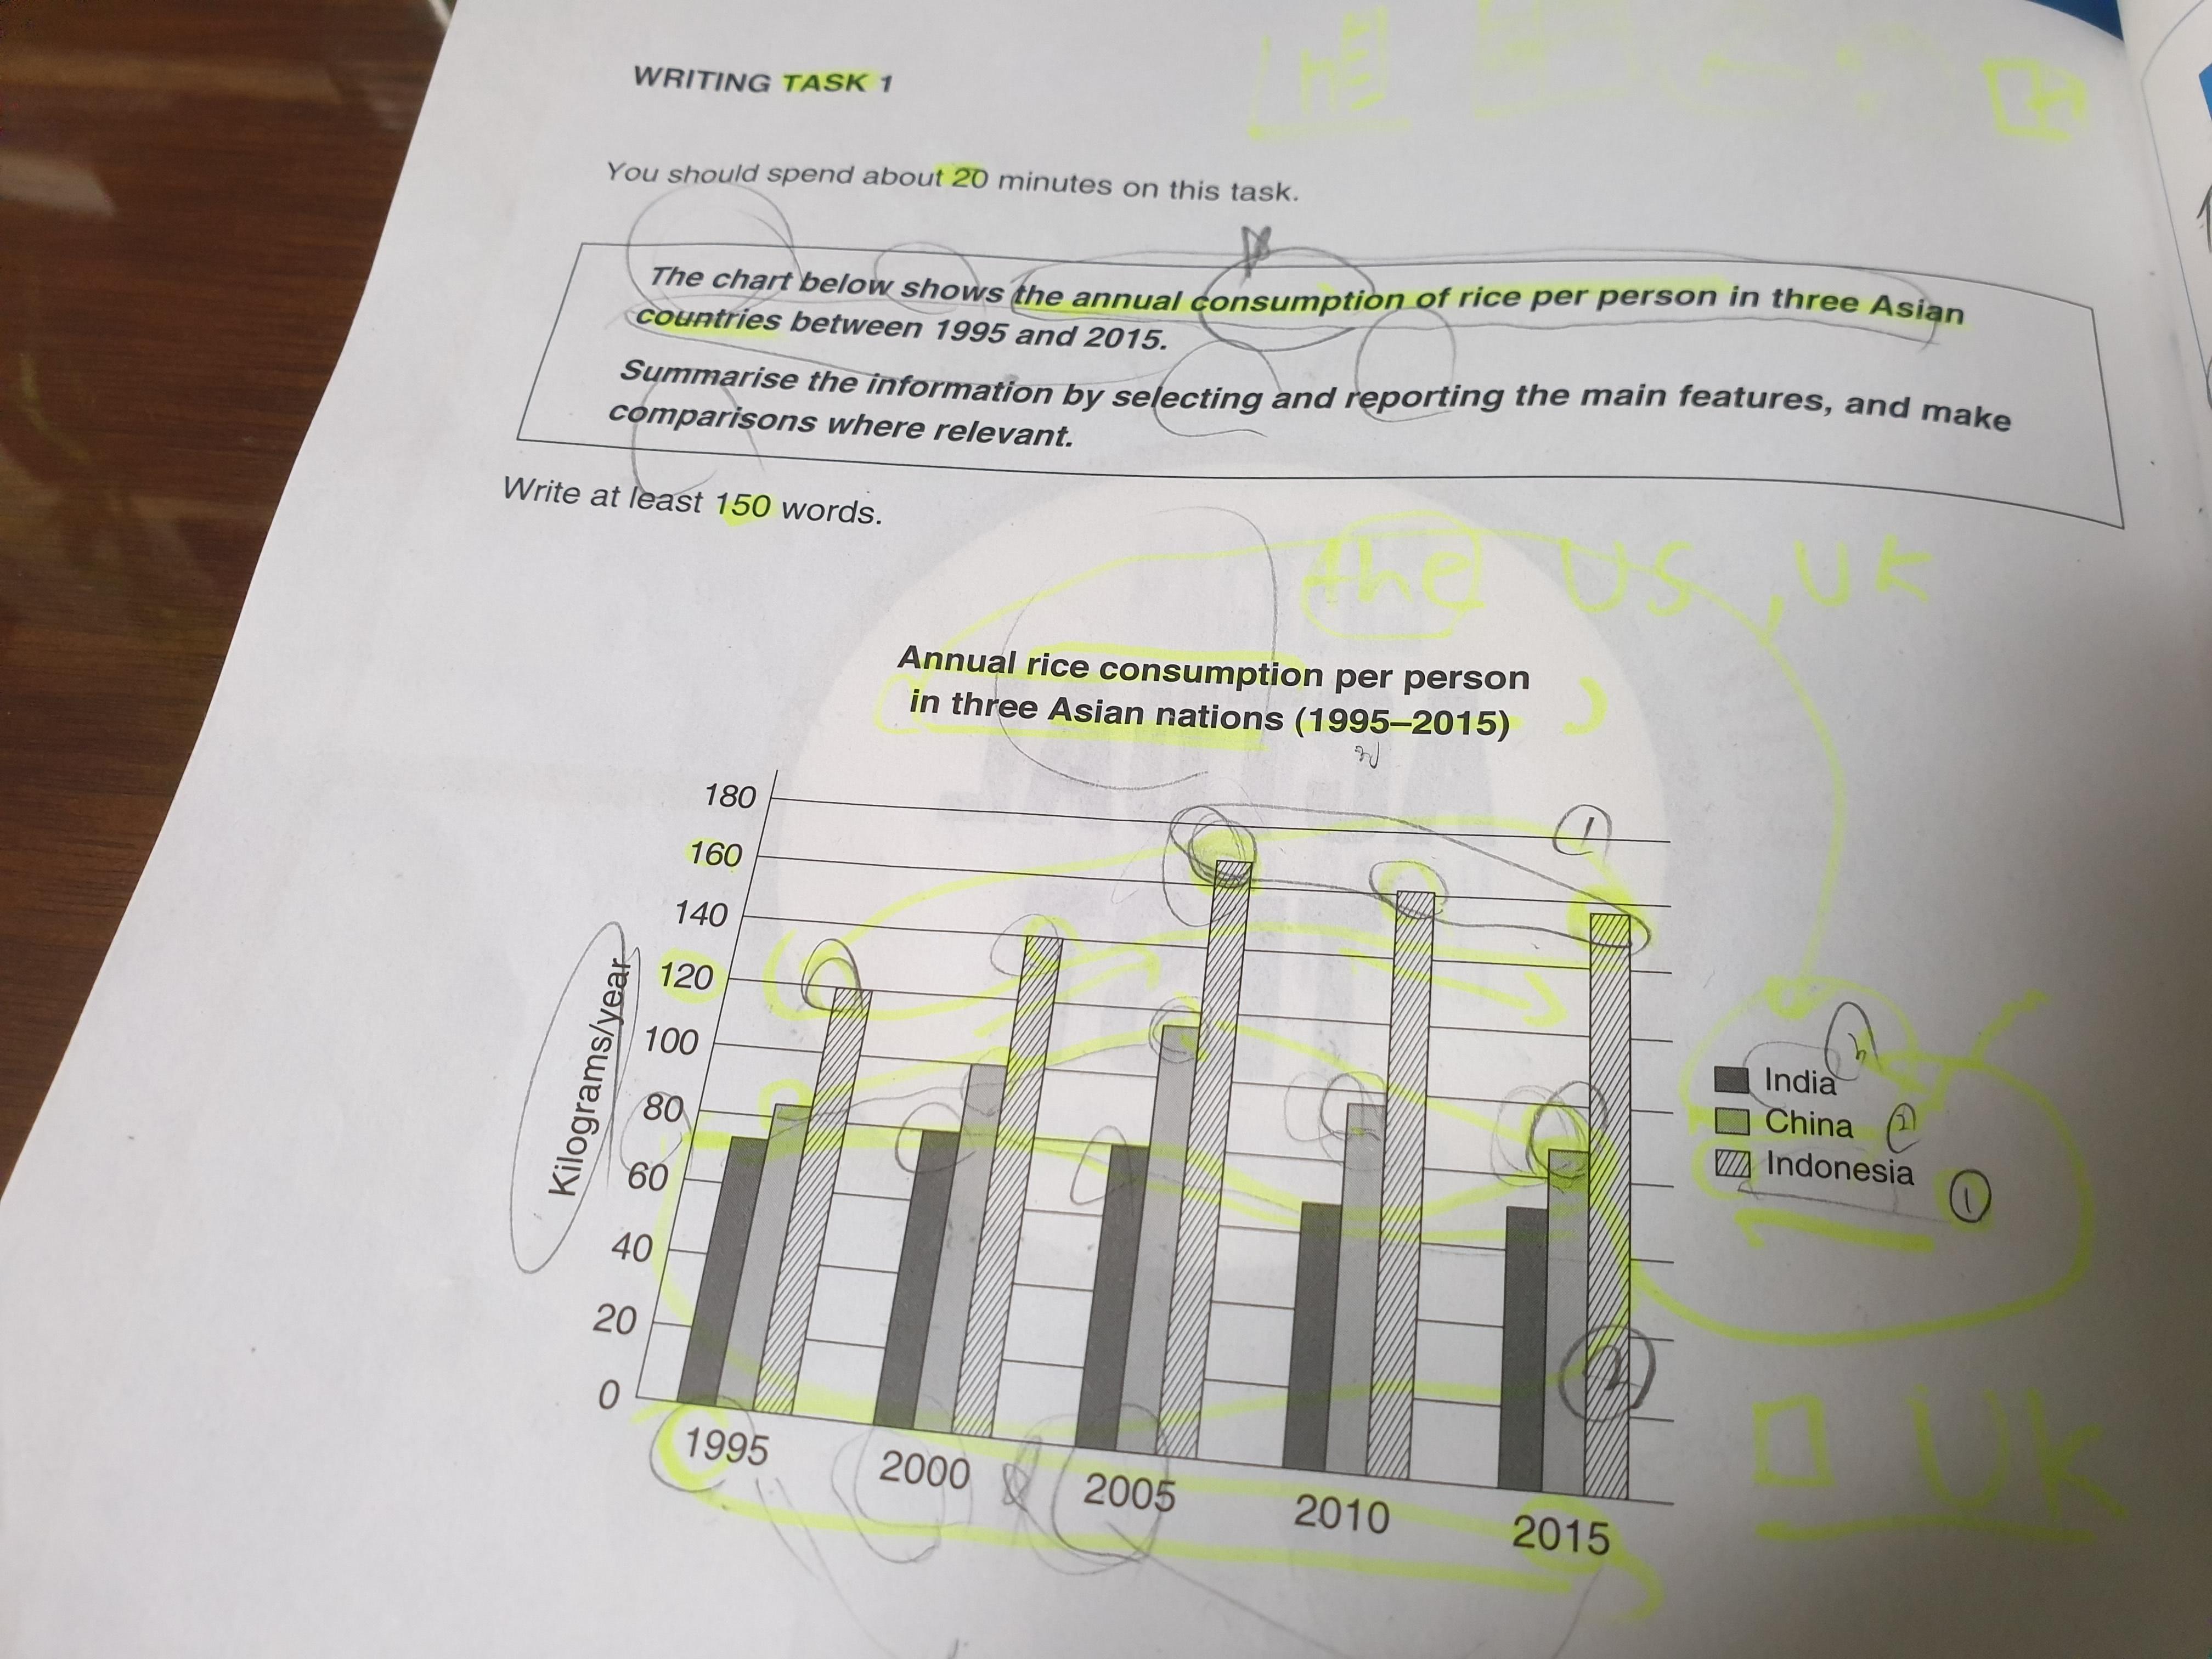
The chart shows that annual rice consumption per person in three Asia nations over 20 years.
Overall, It is evident that the figures of three nations look very similar. In 2005 Annual rice consumption per person is the highest.
Relatively, there is a very slight chage in India compared to two nations.
Looking at the chart more closely one can see that Indonesia's figure is from 120kilogram in 1995 to 161 kilogram in2005.
On the other hand, the figure declines slightly between 2005 and 2015.
Similarily, china's figure has a very similar trend compared to Indonesia's.
This figure is also highest at 119 in 2005, then it decreased gradually.
Finally, India's figure is totally different from China and Indonesia. There is a flat trend.
Between 2000 and 2005, these figures are the same at 80 kilogram and In 2010, this figure declined at 65 kilogram then
it increase at 68 kilogram.

 댓글 0개
댓글 0개


 불편사항 신고