


 인쇄
인쇄


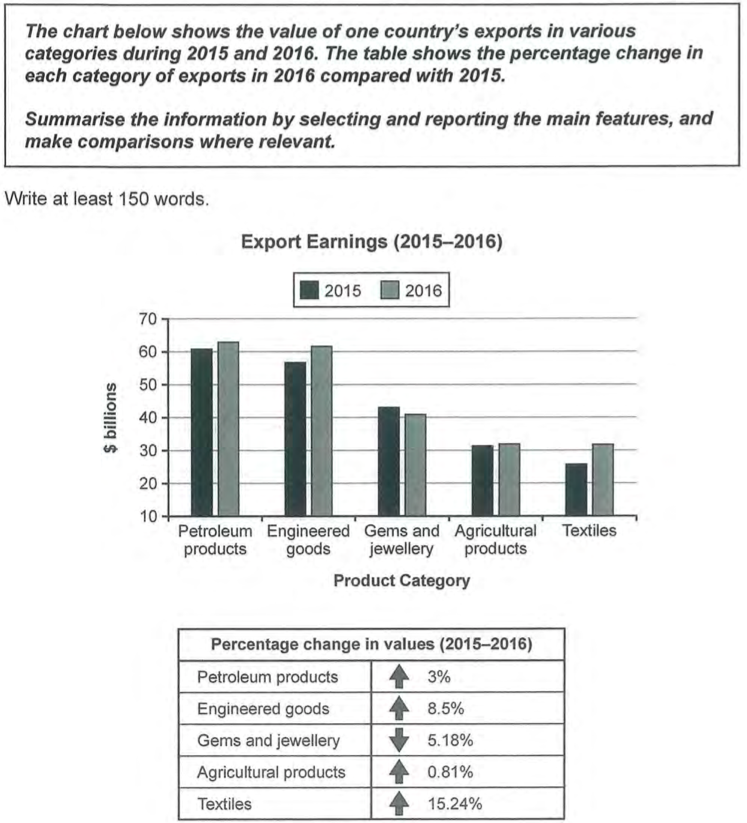
The bar chart represents the value of a country’s professionals in varied categories during 2015 and the following year. The table below illustrates the proportion change in each category of experts in 2016 in comparison to 2015.
It is obvious that experts in petroleum products and engineered goods categories markably earned more money than those who are in other categories in both suggested years. Experts in petroleum products made slightly over 60 billons dollars in 2015 and those in engineered goods made more than 55 billion dollars in the same year. Furthermore, both of them recorded increased number in the next year. Professionals in gems and jewellery made more income than those in agricultural products and those in textiles in the both years. However, they are the only people in the category which has reduced record change in values from 2015 to 2016. People working in agricultural products made profit steadily with the number of around 32 billing dollars. It is extremely remarkable that expert earnings of textiles had the smallest figure in 2015, but it increased 15.24% in one year. Therefore it reached nearly same amount of the earnings of experts in agricultural products.
글자수 : 195 단어

 댓글 0개
댓글 0개


 불편사항 신고