


 인쇄
인쇄


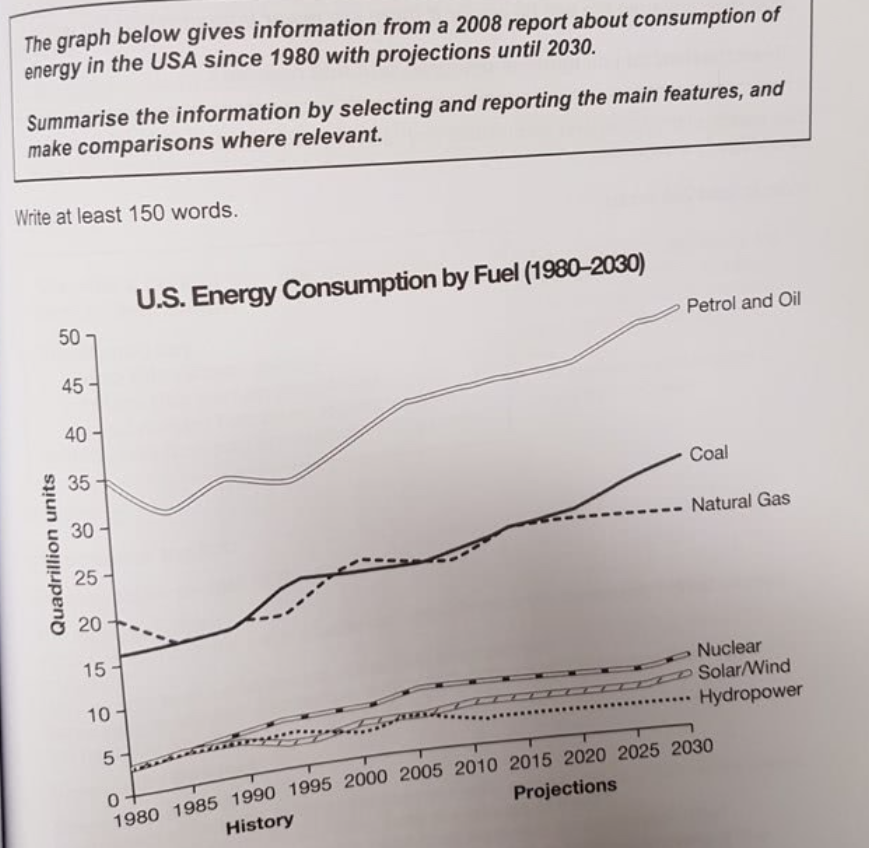
The chart given shows the records and projections of USA’s energy consumption by six types of fuel from 1980 and 2030. In general, all five types of fuels except hydropower is expected to increase in consumption, though there are some gaps in increased volume between them.
First of all, petrol and oil, the most used fuel in 1980 with the figure of 35 quadrillion units is expected to remain as the most consumed fuel until 2030 with the figure of 50 quadrillion units. Meanwhile, the sequence between natural gas and coal is going to be overturned according to the projections. For natural gas, which showed 20 quadrillion units in the consumption figure in 1980 is expected to show short growth after some fluctuations. Meanwhile, the figure of coal is going to be doubled in 2030 within 50 years.
Other three types of fuels which were used 4 quadrillion units in 1980 respectively are not going to change that much in terms of spendings. Nuclear and solar/wind power consumption’s projections tell that the additionally required demand will be between 1 to 3 quadrillion units while hydropower‘s consumptions demand is going to decrease within an almost unnoticeable size.
총평: (8/7/7/7) 7.5
가끔 주어가 부정확한 문제가 있지만, (이 표에서 증가하는 것은 각 자원의 소비량이지, 그 자원 자체가 증가하거나 감소하지는 않습니다.) 그래도 잘 써주셨습니다. 이정도면 충분히 좋은 점수를 받으실 수 있을 거에요. 수고하셨습니다 :)

 비밀번호 확인
 댓글 0개
댓글 0개


 불편사항 신고