


 인쇄
인쇄


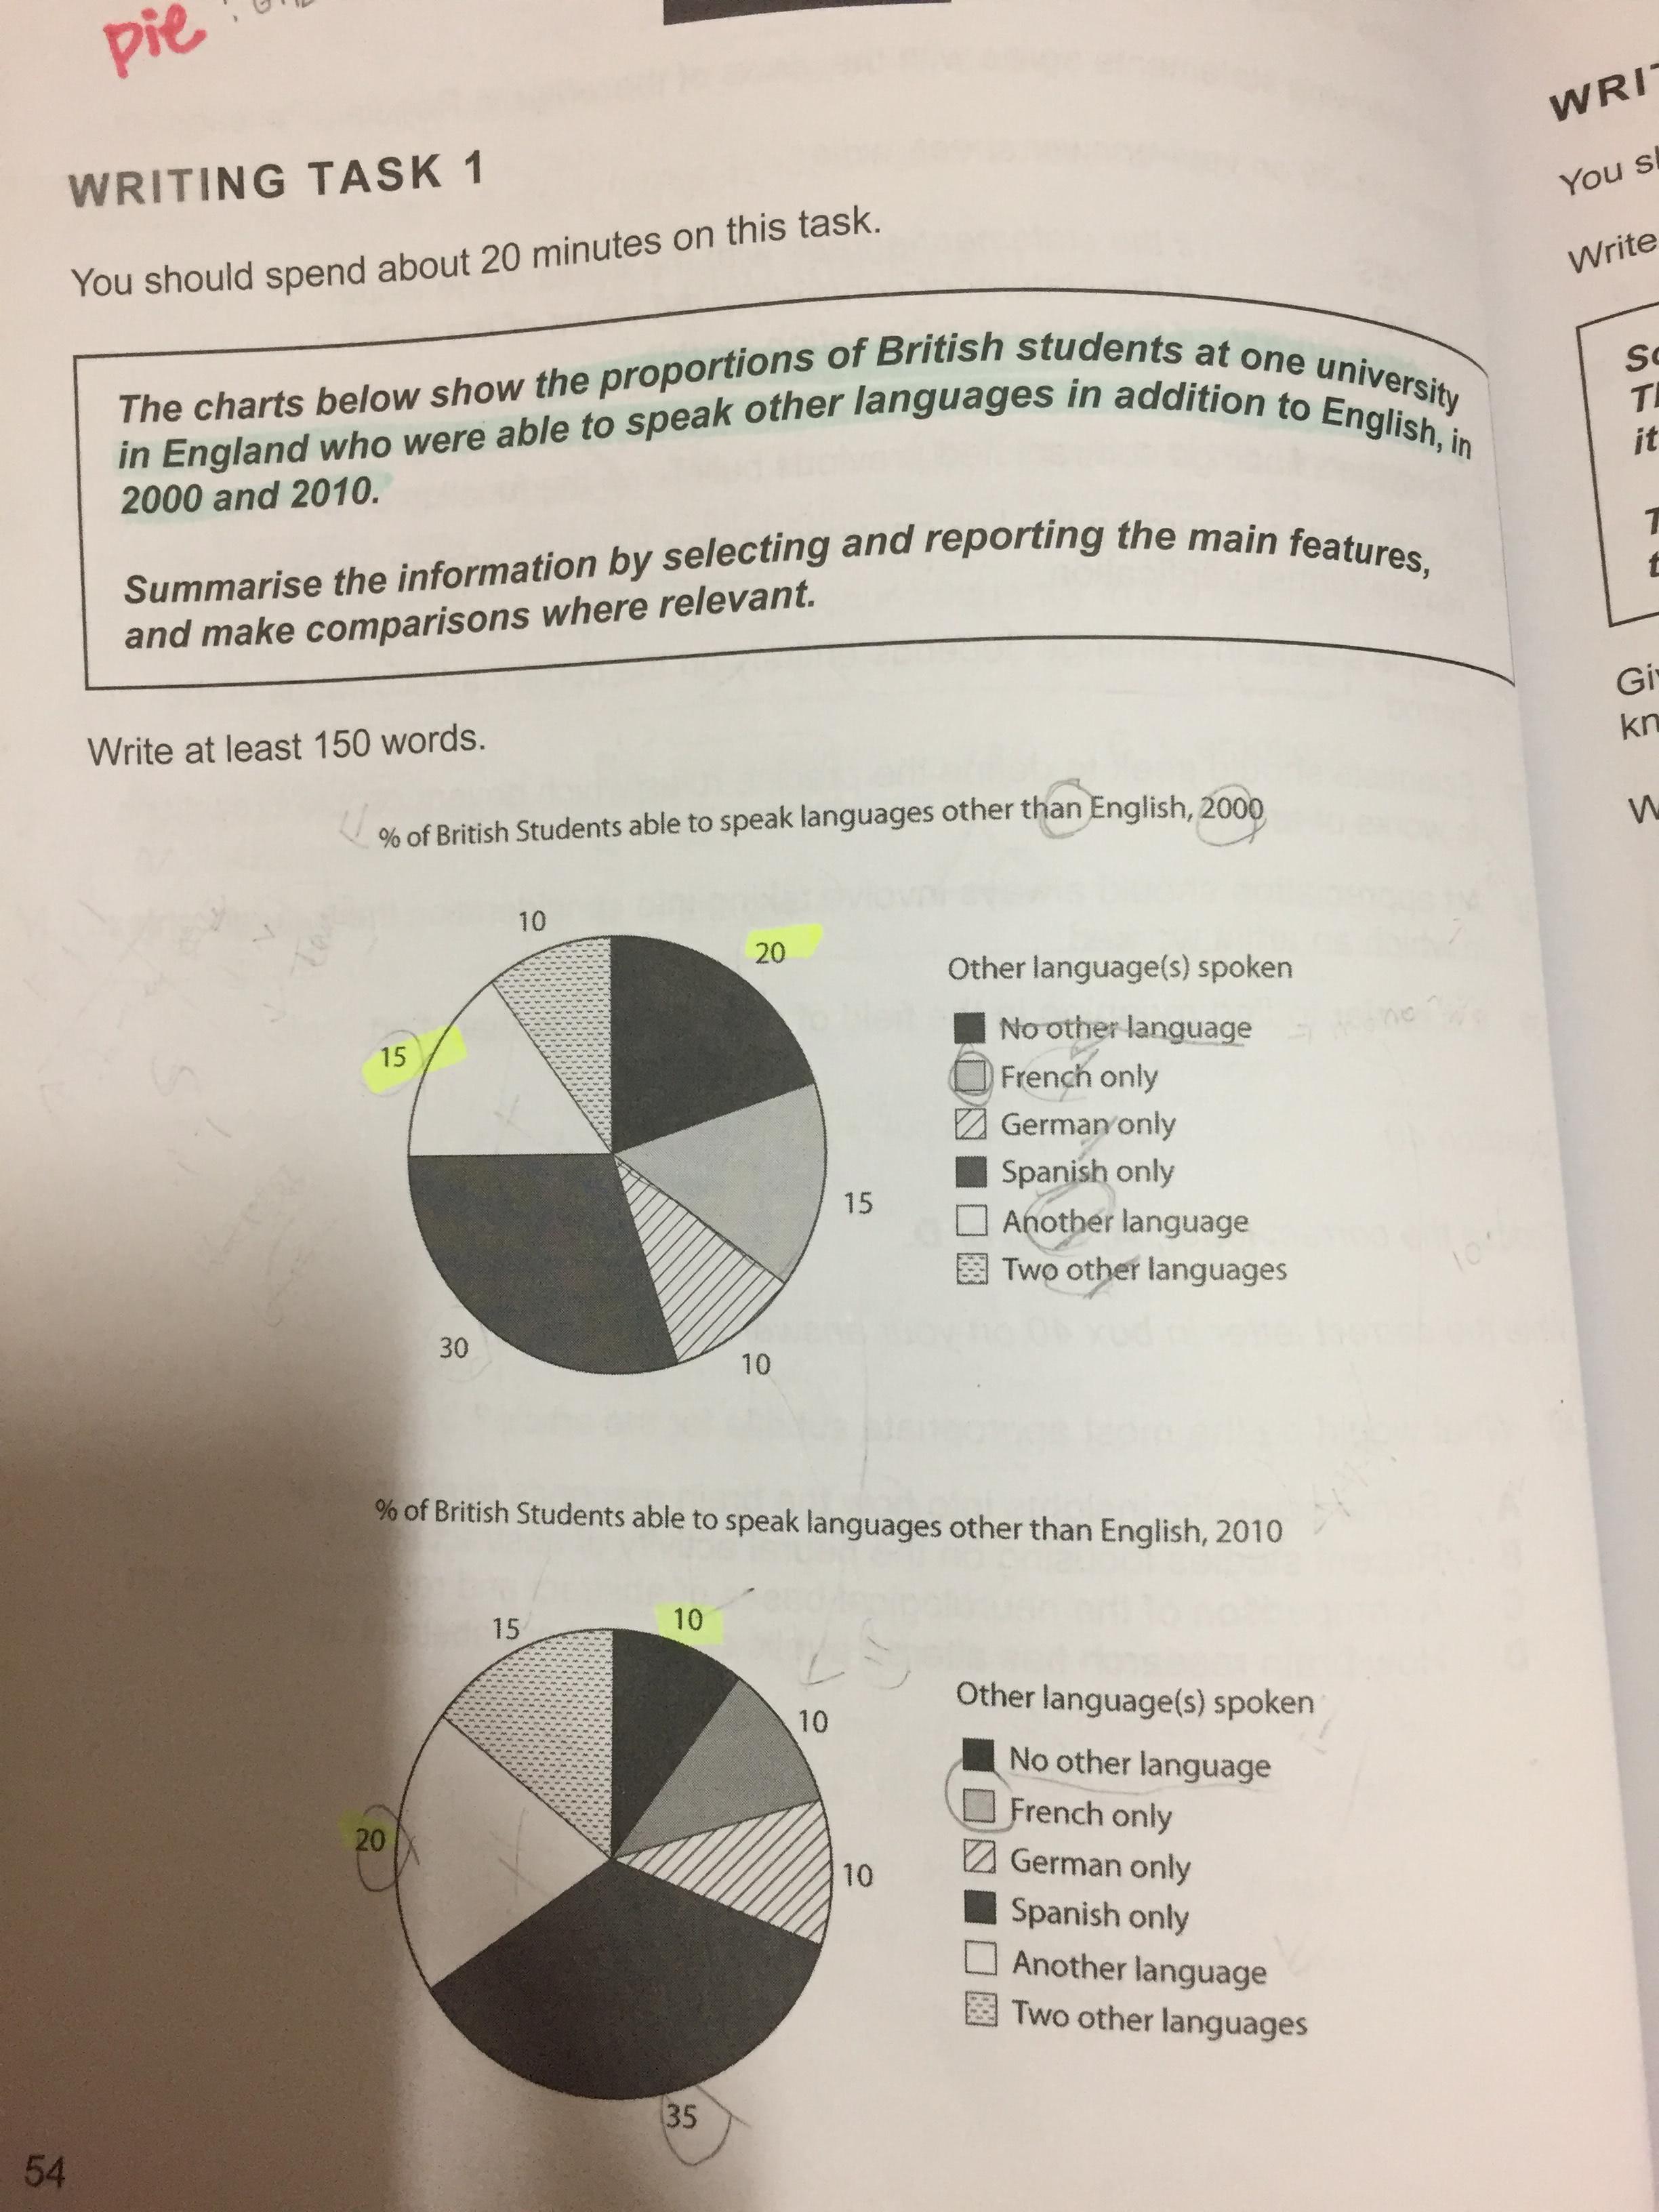
The pie charts illustrate the records about the percentages that learners at the specific college in British could speak various languages including English in the year 2000 and 2010. In general, when the time was the year 2010, the percentage of learner who could not speak language reduced.
Turning to the details, in 2000, the largest percentage was Spanish only, taking up 30%. This followed by students who could not communicate with languages was one-fifth. The percentages of bilingual and French only represented same figure, 15%. The percentages of German only and multilingual were marginal, accounting for 10%.
Meanwhile, learners who could not speak by using languages in 2000 declined by 10% points which constituted the biggest difference in the list. The increased 5% points made up those who spoke bilingual and multilingual, while learners spoken French only decreased 5% points from 15% to 10%. Interestingly, the percentage of German only maintained 10% equally in 2000 and in 2010.

 댓글 0개
댓글 0개


 불편사항 신고