


 인쇄
인쇄


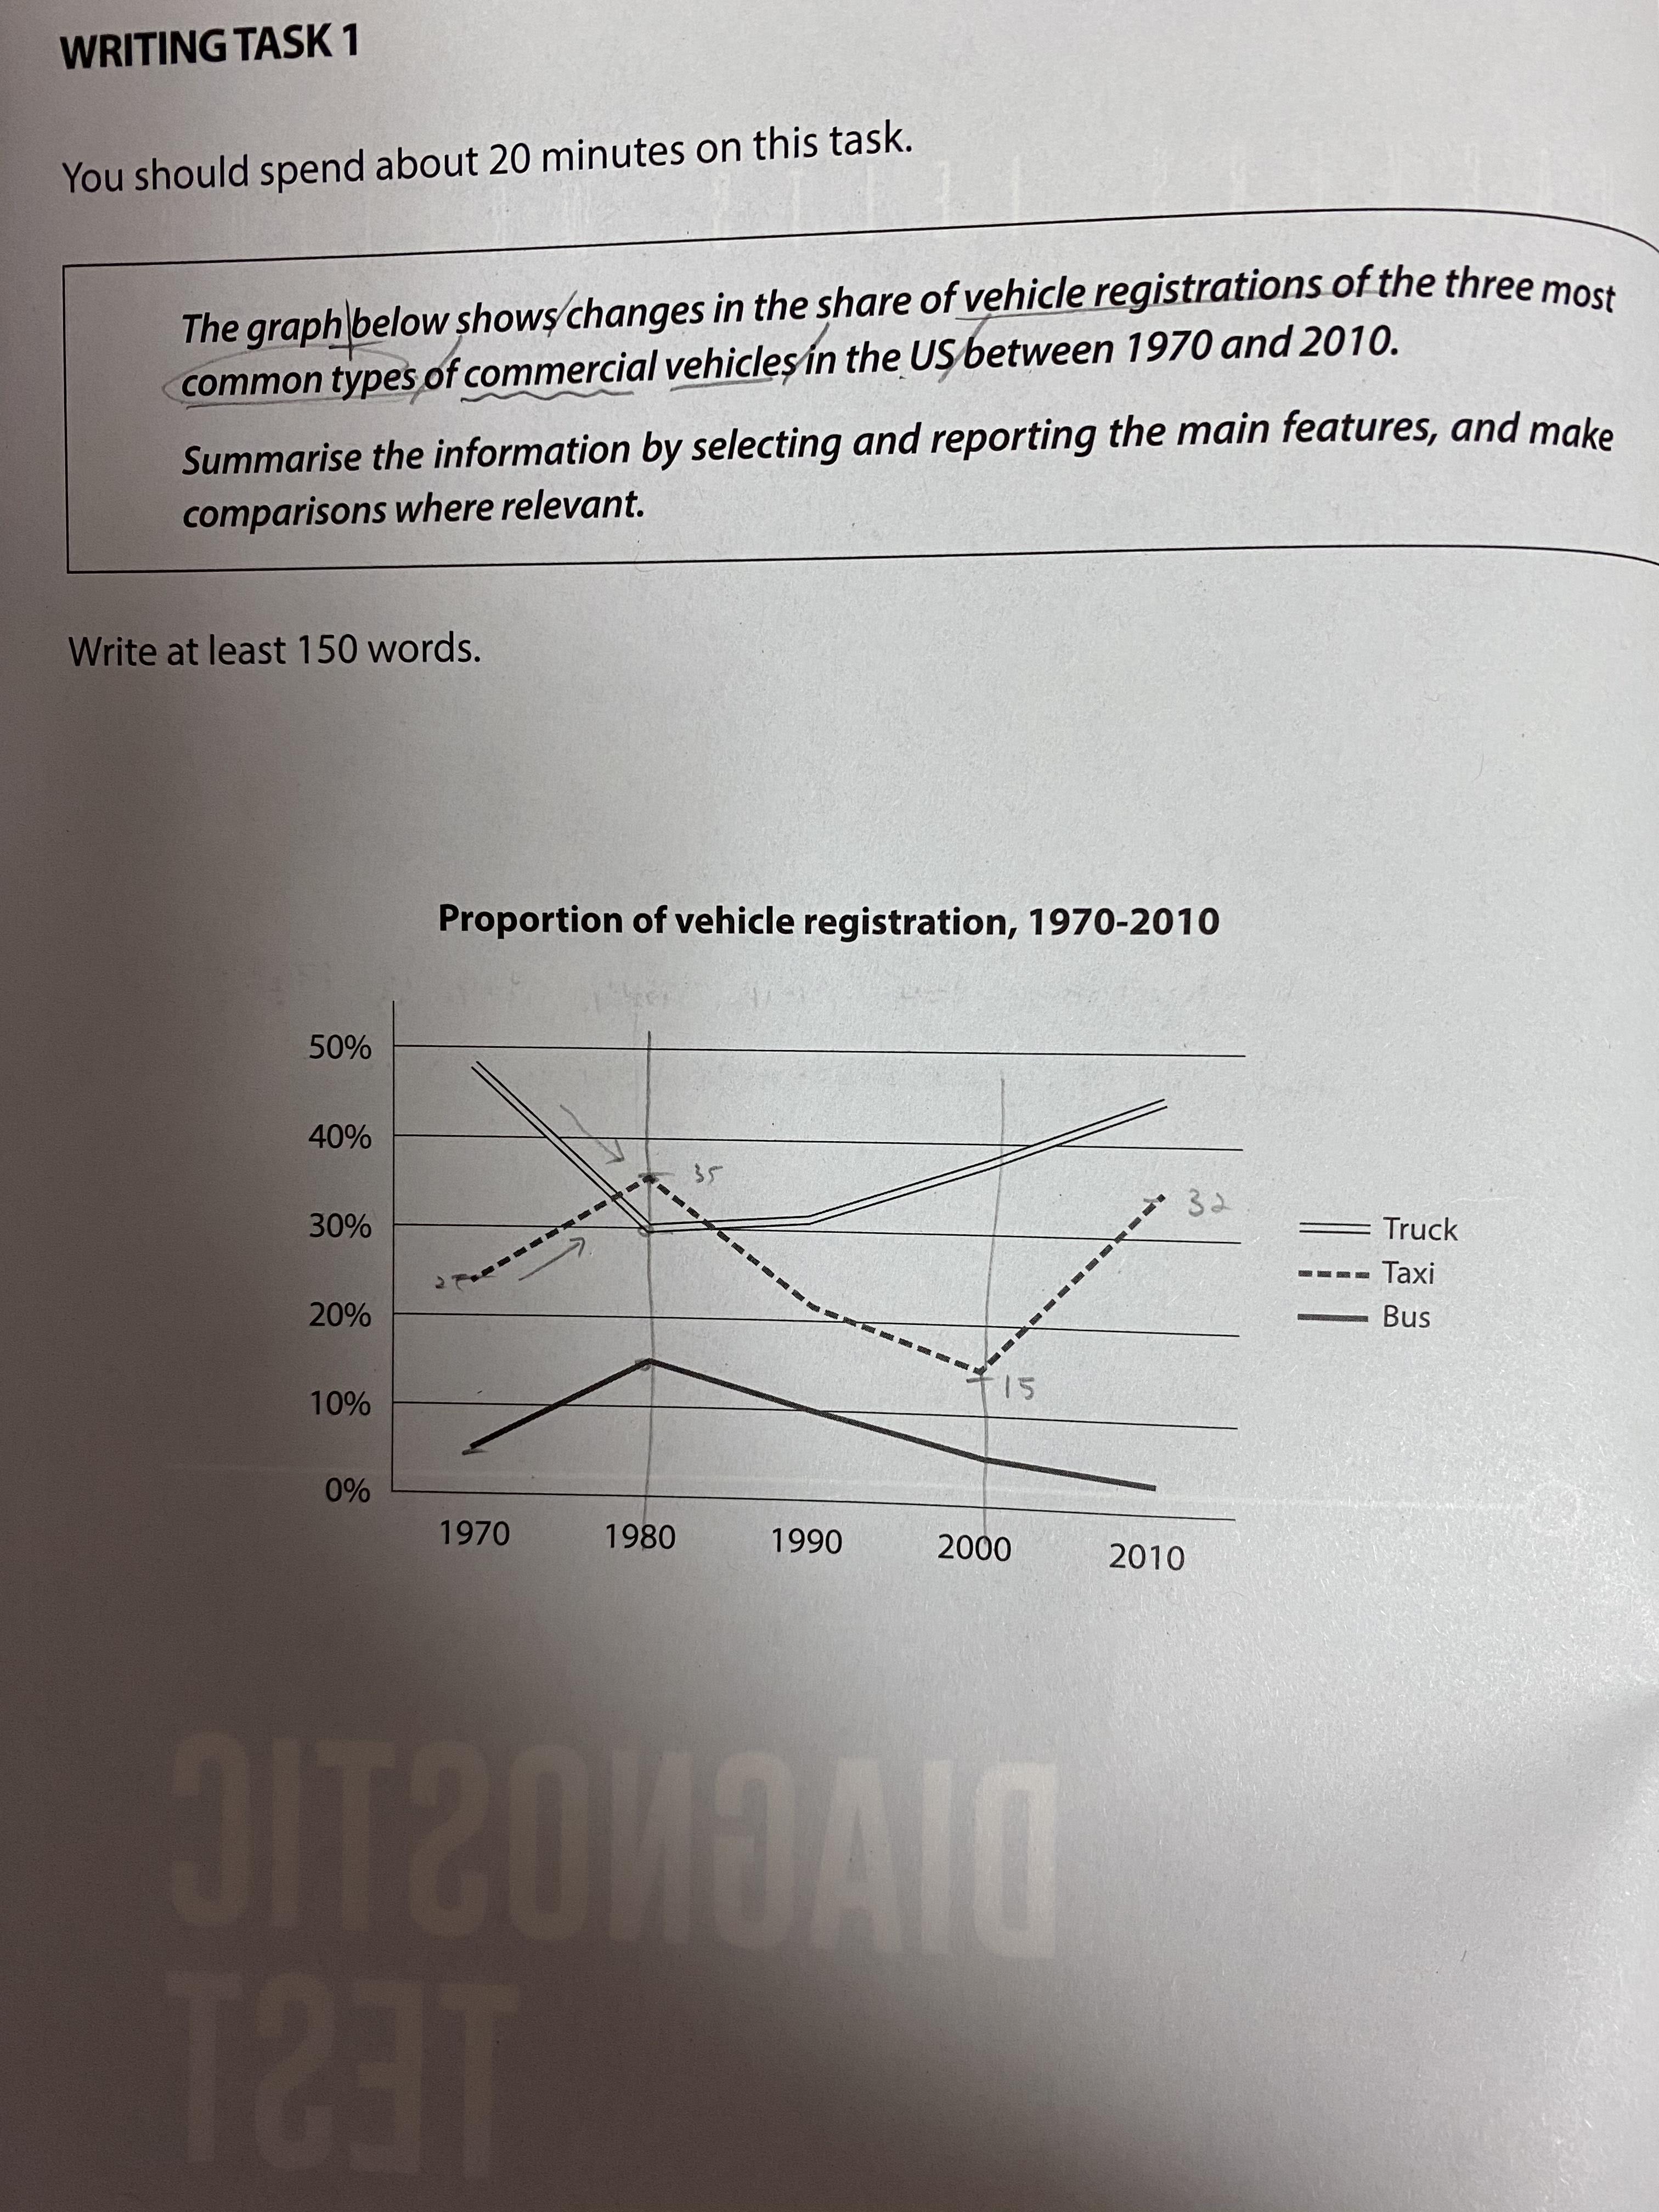
The graph indicates the proportion of vehicle registration from 1970 to 2010. The vehicle types are truck, taxi, and bus, most common types.
The proportion of a truck is 48% in 1970, with the highest rates than others. However, rates of truck registration decreased drastically to 30% in 1980. After 1980, the proportion increased constantly for over ten years.
The rate of a registered taxi is 23% in 1970. The rate goes up significantly throughout ten years from 1970 to 1980. Even so, the rate goes down consistently over the 20-year period.
The proportion of registered bus is 6% in 1970, but the proportion increased continuously until 1980. Yet, the proportion decreased persistently from 1980 to 2010.
The proportion of trucks and buses in 2010 decreased than the proportion in 1970. Besides, the taxi's proportion in 2010 increased than in 1970.

 댓글 0개
댓글 0개


 불편사항 신고