


 인쇄
인쇄


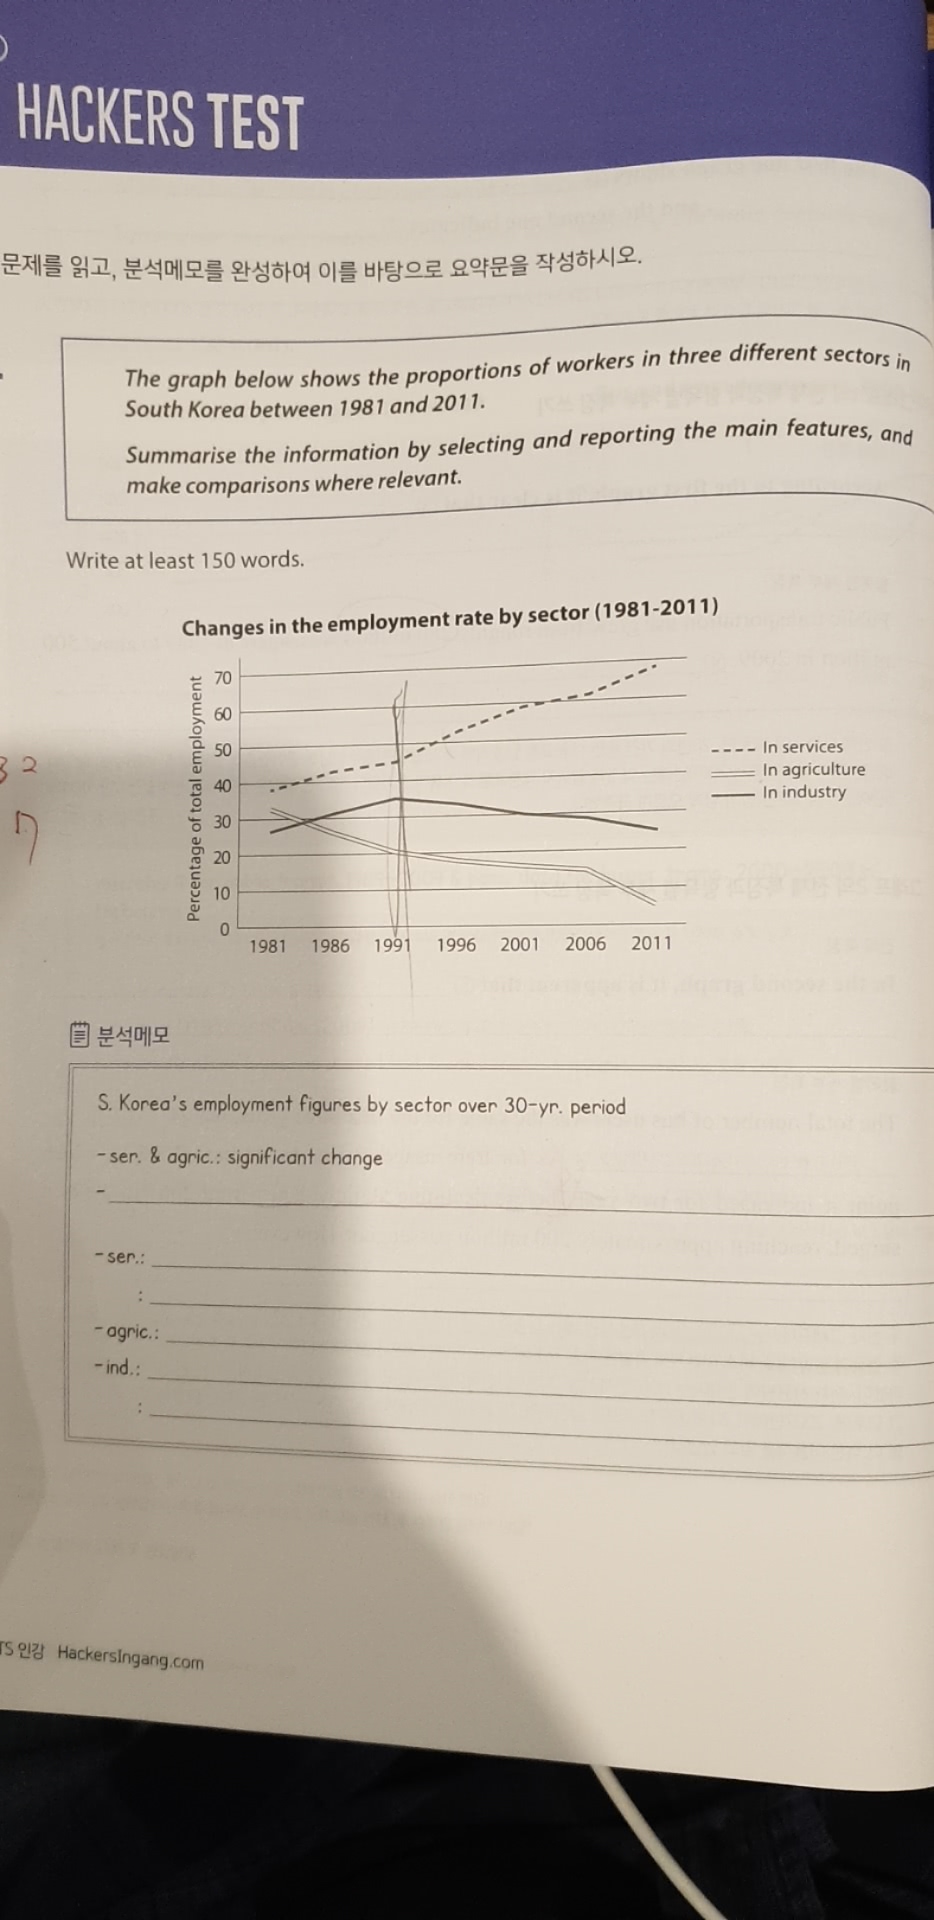
The graph illustrates the proportions of
workers in three different sectors in South Korea between 1981 and 2011.
Overall, the proportion of worker in services grew significantly over the 30-year period. Meanwhile, the share of workers in industry remained constant, but the percentage of workers in agriculture dipped notably.
Looking at the graph closely, the share of workers in services grew slowly until 1991 before it increased quickly from 1991 to 2011, reaching the highest point of nearly 70 percent in 2011. The percentage of workers in industry sector rose considerably until 1991, when it started to dip for the next 20 years. Although a downward trend was seen since 1991, the percentage of employment in industry in 2011 was almost the same as the percentage in 1991. Meanwhile, the employment rate of the agriculture sector experienced a steady decline throughout the period in question. Compared to the 1981 figure, the figure in 2011 decreased by one-fifth.

 댓글 0개
댓글 0개


 불편사항 신고