


 인쇄
인쇄


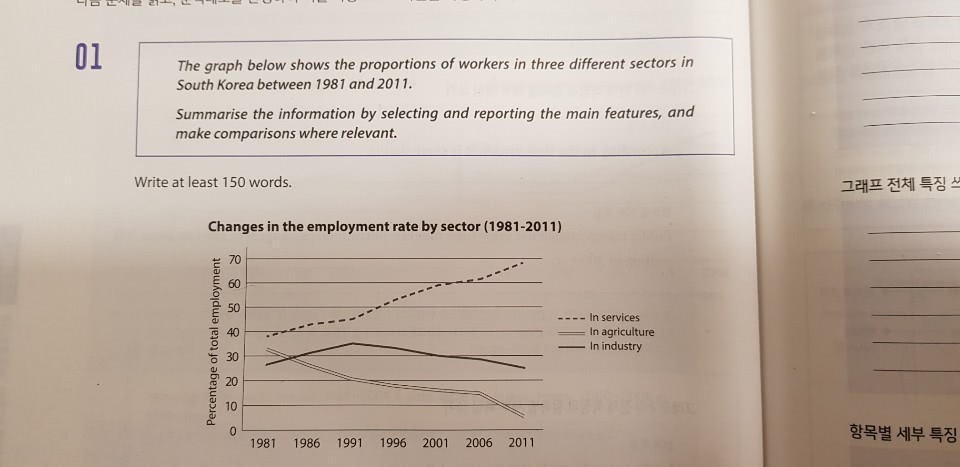
The line graph shows the percentages of employments in the three different sectors in South Korea from 1981 to 2011.
Overall, it is clear that the proportion of workers in services had significantly increased over the 30-year period. In contrast, downward trends were seen in the other sectors between 1981 and 2011.
Looking at the graph more closely, one can see that the rate of workers in services was at around 40 percent in 1981 and it surged gradually, reaching the highest point of about 70 percent in 2011. Meanwhile, the employment rate in agriculture was higher than industry's figure at roughly 30 percent in 1981 but it had plummeted considerably, which was the lowest proportion among the three sectors in 2011. The percentage of employment in industry had slightly ascended until 1991 and then it continued to decline to about 25 percent by 2011.

 댓글 0개
댓글 0개


 불편사항 신고