


 인쇄
인쇄


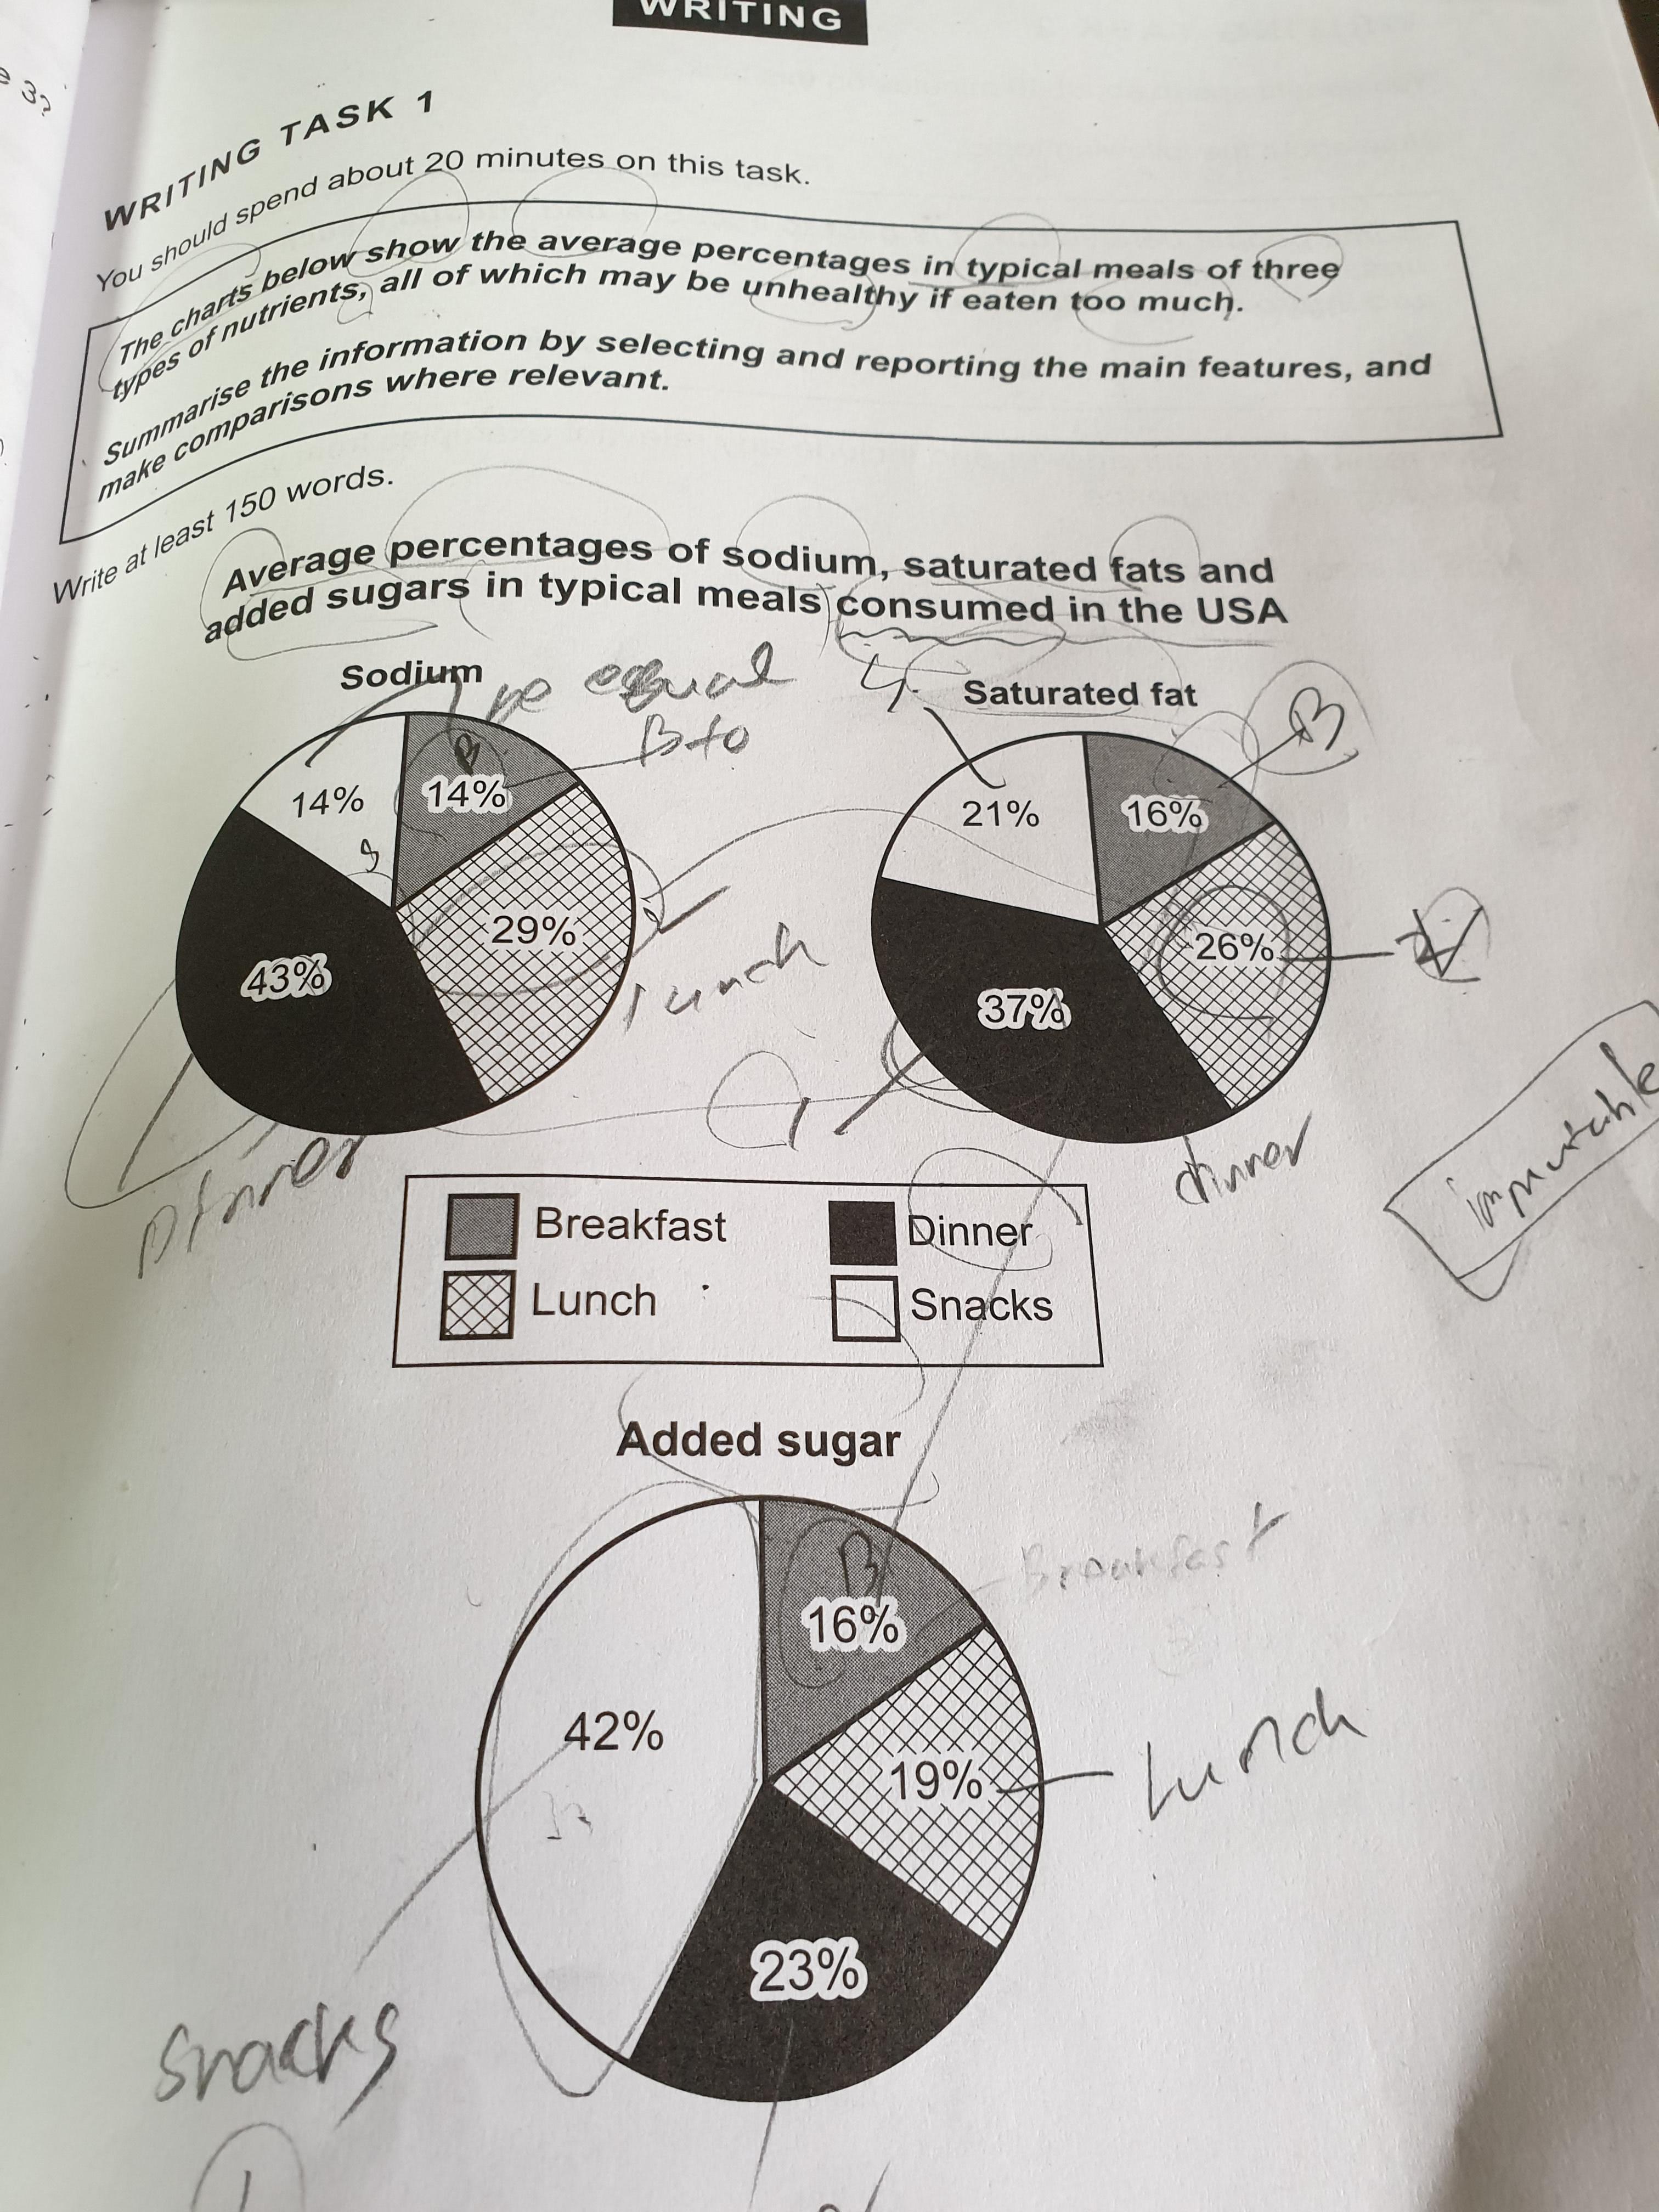
The pie chart indicates that average rate in ordinary meals of three sorts of nutrients if intaken too mch all nutrients may have negative impact on people's health. I will outline three pie chart below.
Overall, every piechart showed that percentages of most nutrients focus on dinner with the exception of added sugar.
As it can be clearly seen by all pie charts, both the percentage of sodium and the percentage of saturated fat consumed dinner the most.The figure if sodium is 43%, and the figure of saturated fat is 37% respectively. In contrast , the rate of added sugar consumed snacks the most at 42%.
Looking at the pie chart more closely, the rate of sodium consumed snacks and breakfast are totally same at 14% each. Not only that between the rate of saturated fat and added sugar spended breakfast are the same at 16%. Interestingly, compared to every pie chart, the rate of all nutrients intook breakfast the least around 15% each.

 댓글 0개
댓글 0개


 불편사항 신고