


 인쇄
인쇄


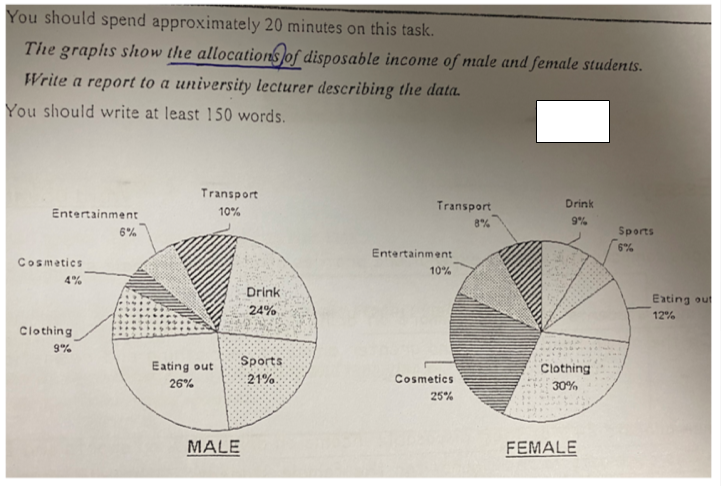
The two pie charts give information about the expenditure trends of male and female student’s income in seven different sectors.
In general,
male students spend much more money on eating out, drink and sports segments
than female students whilst female students tend to spend the large sum of
money on clothing and cosmetics which are not intrigued by male students.
To be specific,
men allocate 26% of their disposal income on eating out, 24% on drink and 21%
on sports respectively. three of them take up a really huge portion to 71%
which is over three quarters. This contrasts with the ratio for the female
students as they only spend 12% on eating out, 9% on drink and 6% on the sport.
On the other
hand, women spend a substantial amount of money on clothing and cosmetics which
are together at 55% and it is followed by eating out at 12%. However, male
students spend 9% on clothing and especially, the cosmetic is by far the least
industry; 4% only. Last not but least, the remaining two parts, entertainment
and transport for both parties show pretty much similar spending trends to 6%
and 10% for men and 10% and 8% respectively.
목표는 7.5 입니다! 많은 조언 부탁 드립니다.

 댓글 0개
댓글 0개


 불편사항 신고