


 인쇄
인쇄


이게 topic이고 저는 이렇게 적었습니다.
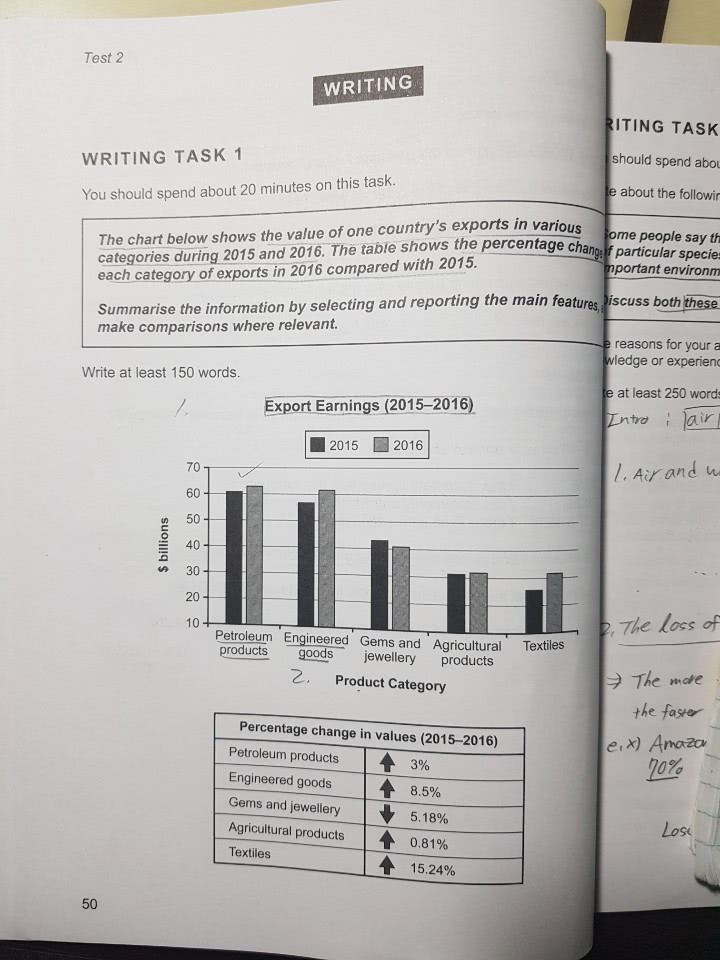
The bar chart illustrates data regarding the total earnings from shipping out in 5 distinct categories in the years 2015 and 2016 and then the table indicates how the values of 5 exports items changed as a percentage at the same time.
According to the bar chart, it is apparent that an upward trend was seen in the values of 4 exporting products apart from gems and jewellery. In the table, the most striking one is that the proportion of textiles rose, while that of gems and jewellery declined between 2015 and 2016.
Looking at the bar chart more closely, one can see that petroleum products were the highest value among 5 different items and then its export earnings climbed from reaching at around $60 billion to nearly $63 one. Then, there was a significant increase in the values of engineered goods and textiles. Meanwhile, the entire earnings of agricultural products remained unchanged, keeping at more than $30 billion. As can be seen from the table in detail, those of petroleum products, goods aiming for agriculture and engineering as well as textiles grew. In particular, the third aforementioned one did so 15.24%. By contrast, that of gems and jewellery dropped 5.18% over the year. (on time, 204 words)
항상 감사합니다. 비밀번호는 1234입니다.

 댓글 0개
댓글 0개


 불편사항 신고