


 인쇄
인쇄


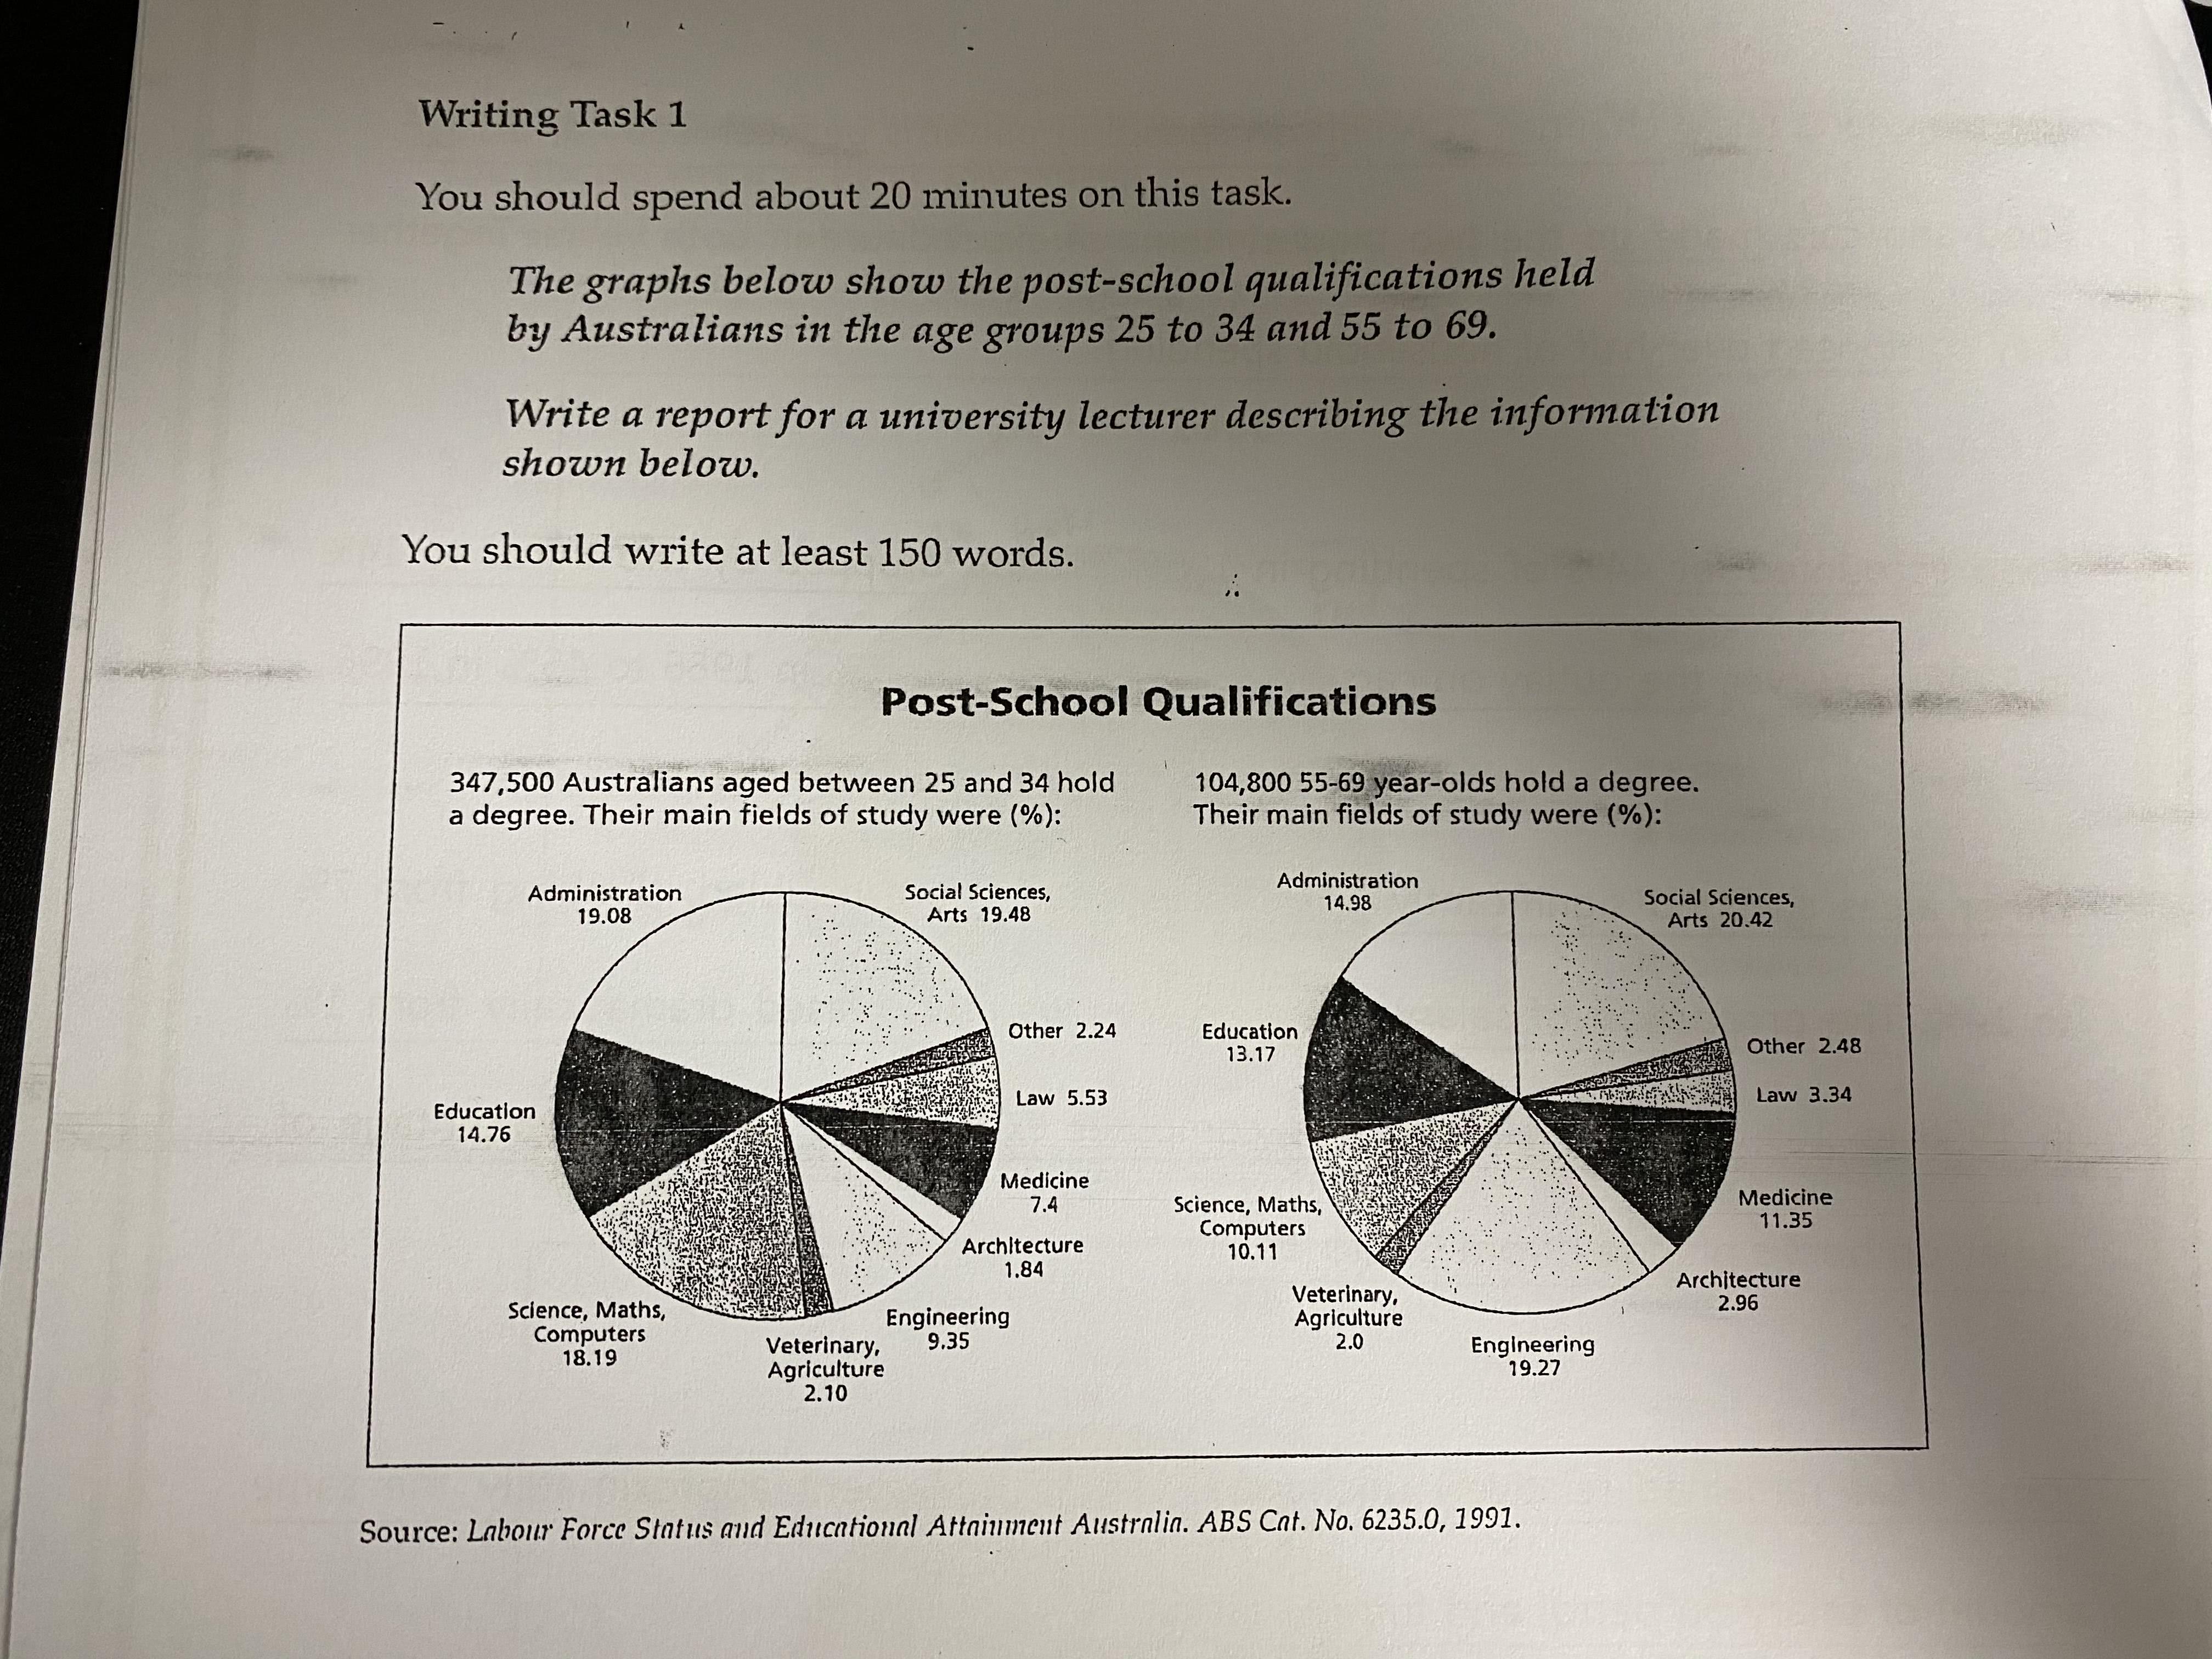
The two pie
charts give information about the proportion of the post-school qualifications
between two different groups; 25~34 years and 55 ~ 69 generations in Australia. (in Australia, 즉 호주에 있는 사람들과 Australian 은 약간 다릅니다. 외국인 때문이죠. 예를 들면 제가 호주에 여행에 가게 될 경우 전자에는 들어가지만 후자에는 못 들어갑니다. 물론 이러한 사항들은 6점대에서는 중요하지 않지만, 삼쏭님처럼 7.5, 아무리 못해도 7.0 필요하신 분들은 꼭 챙기셔야 해요.)
In general, it
is noticeable that the people who studied in the main industries in both groups
showed pretty similar trends. The social sciences, art is by far (by far 와는 전혀 거리가 멉니다. 제일 높은 건 맞지만, 바로 뒤따르는 항목들과 끽해야 6퍼센트포인트 정도만 차이가 나죠.) the most
preferable filed and the next main industry is the administration in two
different charts.
In detail, the sum of the rates of social sciences, arts and administration in generation age groups accounted for
approximately 29% and 35% respectively. it (이런 대소문자 하나하나도 7.5에서는 매우 중요합니다.) is followed by education; 14.76% in
the first group and there is only about 1% point behind in the second group. Conversely,
veterinary, agriculture is the least shows the lowest ratio of the study filed which takes up
around 2.0% each.
What we can see
in the first chart, science, maths, and computers make up to 18.19% in the
younger generation group. It is a substantial gap compared to the latter group;
to 10.11% only. In contrast, there is a huge difference in the ratio of the
engineering field between two groups and the younger group behind more than 10%
compared to the older group. It showed a similar allocation in terms of the
remaining sectors such as other, law, medicine and architecture although there
are slight and mere differences.
총평: (7/7/7/7) 7.0
큰 틀에서의 문제는 없었기 때문에 7.0은 웬만하면 받으시겠지만, 7.5를 위해서는 위의 자잘한 부분들도 최대한 해결돼야 합니다. 특히 field 철자를 연속해서 두 번 틀리거나, 단위를 빼먹거나 등의 실수는, 줄여주시는 선에서 끝나는 게 아니라 반드시 없애주셔야 합니다. 수고하셨습니다 :)
목표는 7.5 입니다 ! 많은 조언 부탁드립니다.

 비밀번호 확인
 댓글 0개
댓글 0개


 불편사항 신고