


 인쇄
인쇄


목표점수 6.5
도움 없음
단어수 190
시간 30분
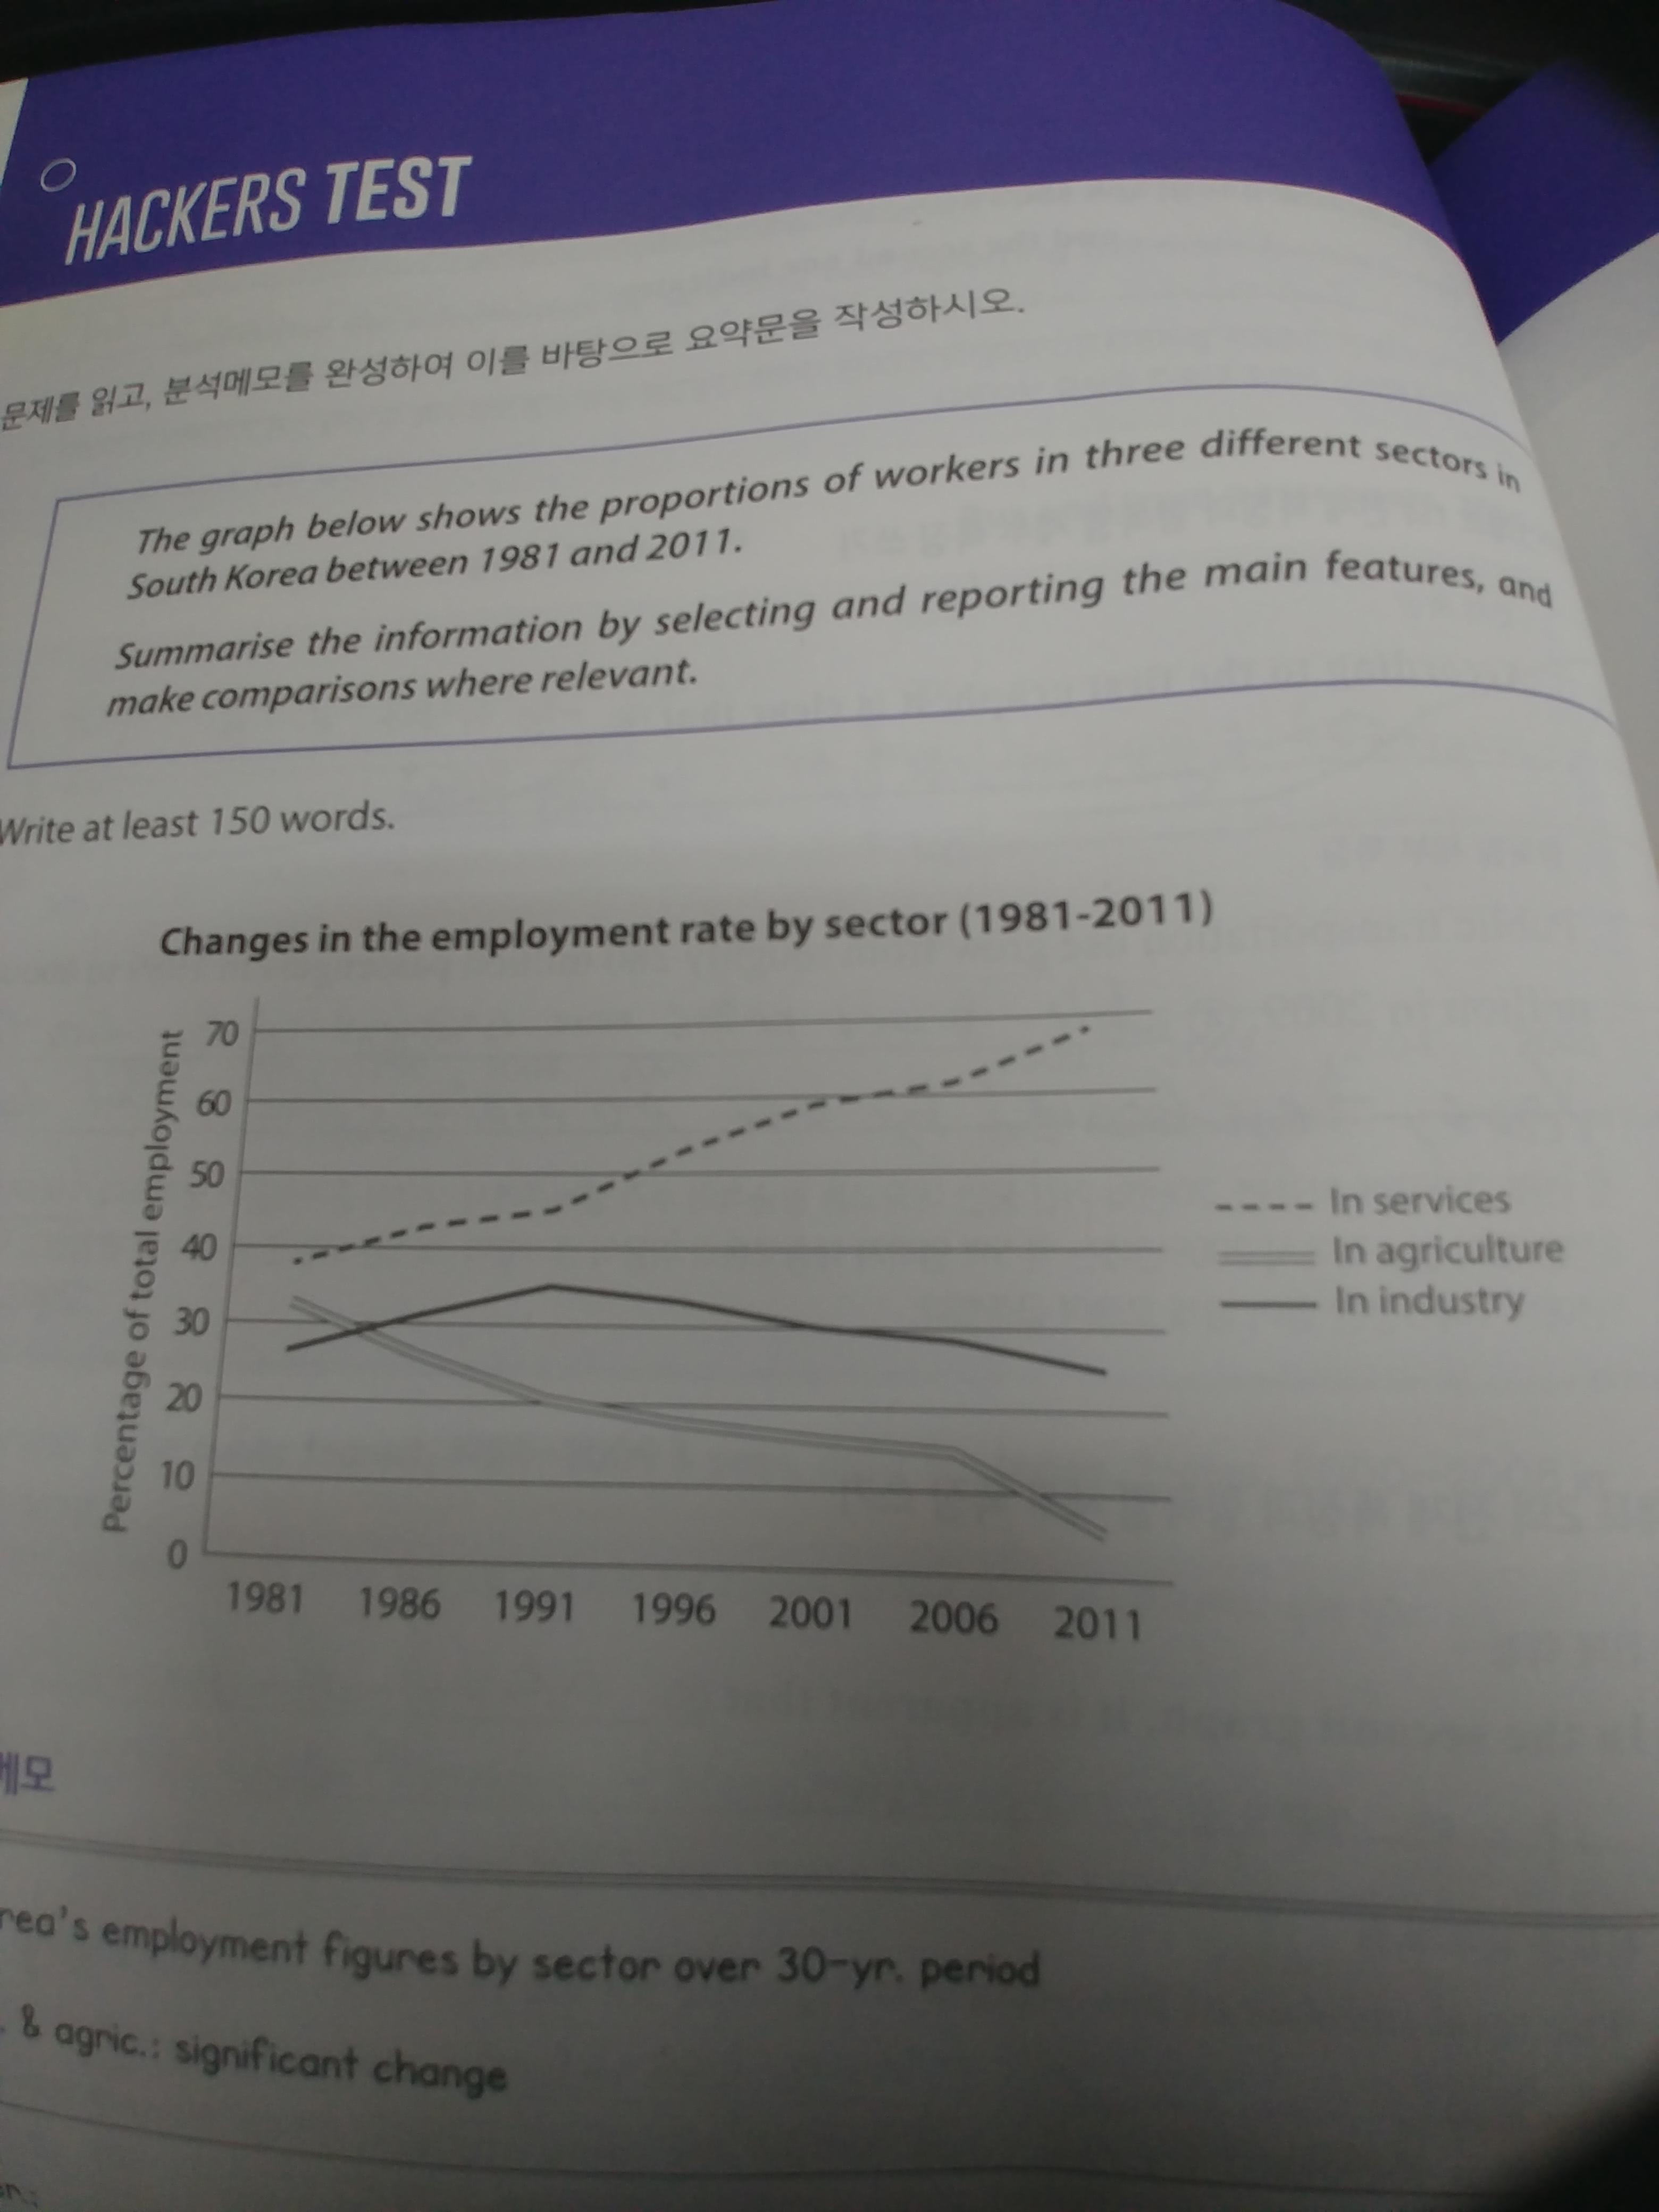
The line graph illustrates the portion changes of workers who worked in service, agriculture, and industry from 1981 to 2011 in South-Korea.
Overall, for period in question, the proportion of service workers has soared significantly. On the one hand, In agriculture, the share has plummeted gradually and there were some fluctuation in industry field, but remained relatively stable as it comprised in 1981.
Looking at the graph more closely, one can see that the rates of workers in services sector was almost 40% and the biggest sector among three different sectors at the first year. It has increased until the last year in question and peaked at 70% in 2011. However, In case of agriculture sector, while the its rates had started 32% which was 80% of services sector's rate, it has plunged until 2011. Finally, it came to 5%, one-sixths of its share in 1981. The proportion of worker in industry had percentage which was similar with agriculture at first. The rates of it had rose considerably between 1981 and 1991 before declining consistently from after. Originally, it made up 35% of total percentage of total employment, finally, as a result of decreasing, it accounted for only 5%. Compared to the first and the last year in period, the biggest changes was the gap between service and agriculture. It had been only 10% at first year, but at last, the percentage of service was almost 12 times of the other.

 댓글 0개
댓글 0개


 불편사항 신고