


 인쇄
인쇄


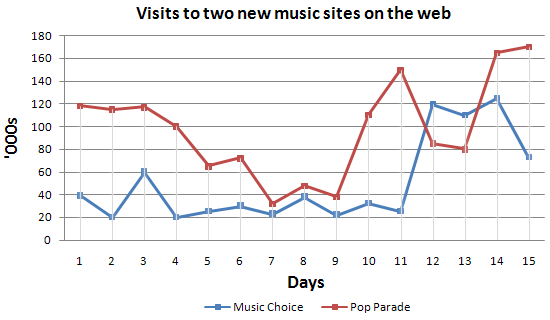
The graph below compares the number of visits to two new music sites on the web.
Write a report for a university lecturer describing the information shown below.
You should write at least 150 words.
This graph indicates the number of people visiting two different music sites for half-month. The red line belongs to the Pop parade (이것까지도 포함해서 하나의 고유명사이므로, 대문자 시작입니다. 뒤의 choice 도 마찬가지이고요. 밑의 문단에서도 수정해주세요!) and the blue line shows the figure of Music choice. Overall, those two lines fluctuate recording the increased number. (여기는 어떤 의미로 적어주셨나요? 댓글 주시면 확인하고 수정해드리겠습니다.) Their final gap between the users of two sites seems to remain similar as the first one the same as the first gap. However, while the red line fluctuates considerably, the blue line varies slightly except in the day 12 and 15.
Looking at the graph thoroughly, until day 7, there is a similar trend in fluctuation only with a difference in level. Interestingly, in days 7 to 9, both lines have a similar figure in fluctuation. In contrast, from day 9 to 11, the red line soars increasingly while the blue line moves in a small amount. On day 12, while the red line shows a decline, the blue line goes up enormously (구어에 가까운 편이라 가급적이면 쓰지 않는 게 낫습니다.). At this point, the number of visitors that the blue line indicates exceeds the red one’s visitors. Until day 13, visitors who visit Music choice are more than the visitors of the Pop parade. However, due to the high increase in Music choice on day 13, on day 14, the ranking changes and the red one takes first place again. On day 15, the blue line goes down again and the red line increases slightly.
총평: (6/7/7/6) 6.5
일단 세부적인 분석을 할 때에는 구체적인 수치를 인용할 수 있어야합니다. 그렇지 않고 지금처럼 큰 흐름만 서술할 경우 반쪽짜리 분석이 되어버리죠. 또한 조금 더 전체적인 분석으로는 두 사이트 방문객의 합이 1일에 비해 15일에 훨씬 증가했다는 점을 적는 것도 괜찮고요. 수고하셨습니다 :)
(222)
19분
감사합니다 ^^

 비밀번호 확인
 댓글 1개
댓글 1개


 불편사항 신고