


 인쇄
인쇄


안녕하세요!!
제 목표 점수는 6.5 ~ 7.0 입니다. 항상 이렇게 첨삭해주셔서 감사합니다.
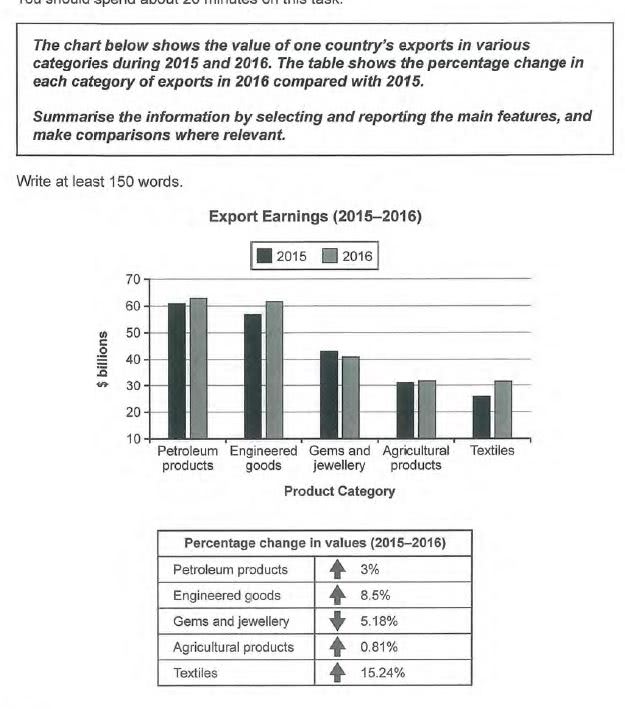
The given chart and table give information about values and percentage changes respectively based on several categories in one country from 2015 to 2016. Looking from an overall perspective, it is clear that values in all but gems and jewellery went up slightly in 2016 compared to 2015.
As for petroleum products which were the best lucrative products with over $60 billion in 2015, they were almost caught up with by engineered goods with earning rising by 8.5 percent points in just one year. When it comes to textile, the figures of export income were approximately half of petroleum products’ export earnings in both of 2015 and 2016. By contrast, a fluctuation of textile was the largest one among other type’s change by 15.24% to just over $30 billion, while there was almost no change in the amount of income from agricultural products. Finally, the only reduction in revenue occurred in gems and jewellery by 5.18 percent points to roughly $40 billion.

 댓글 0개
댓글 0개


 불편사항 신고