


 인쇄
인쇄


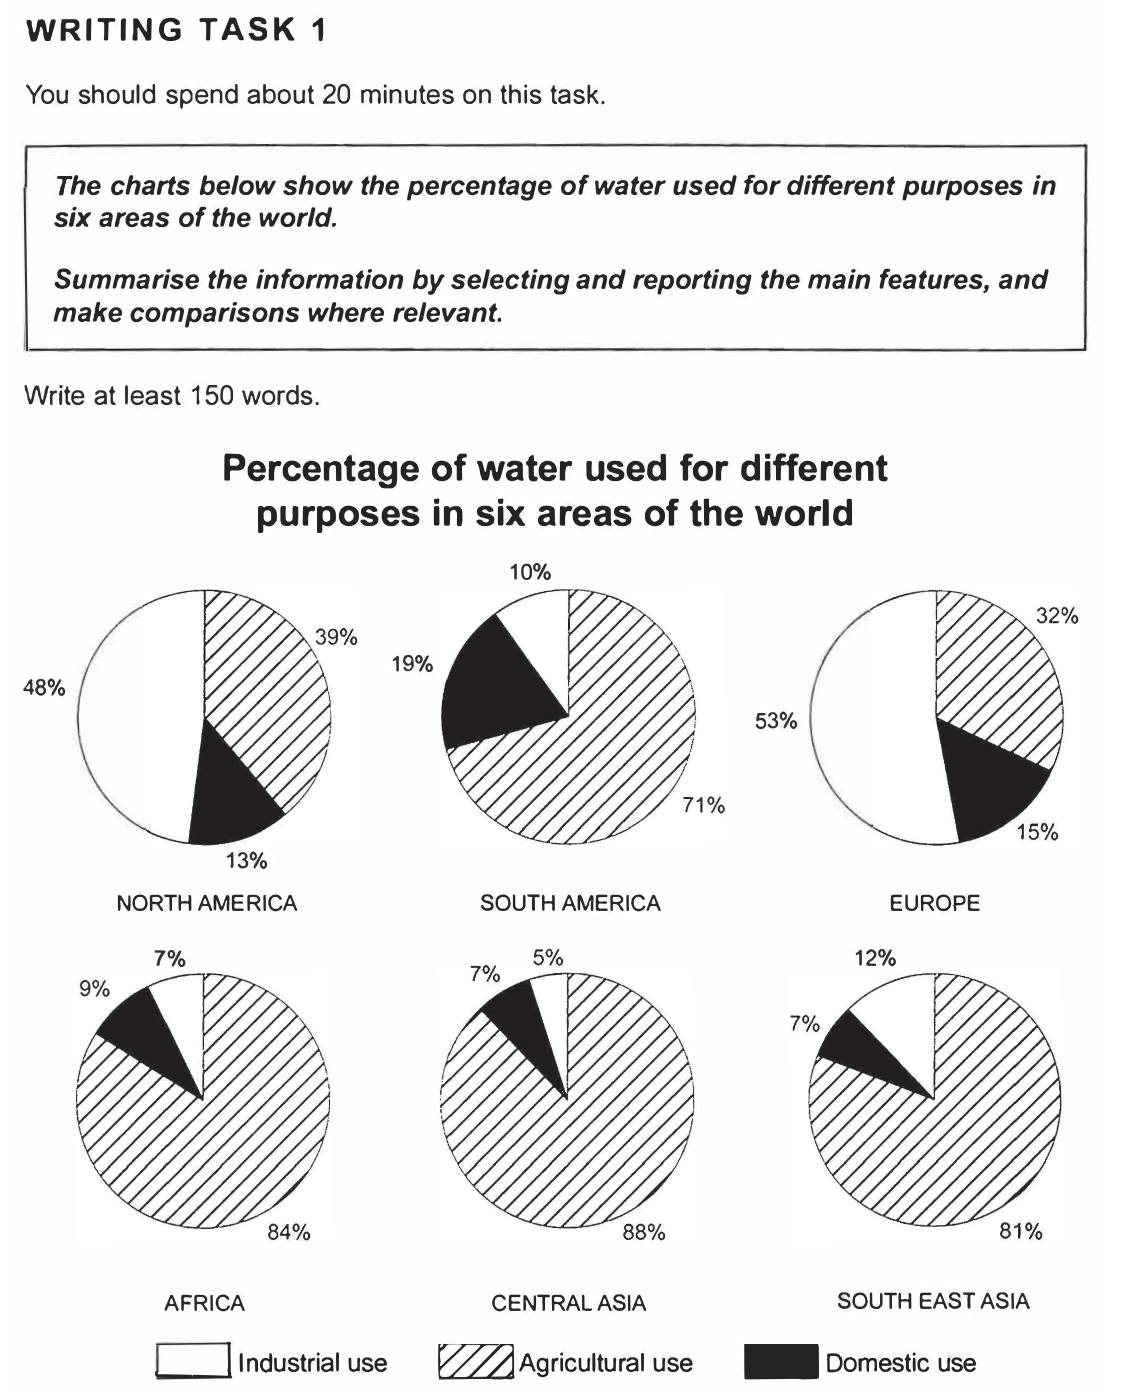
The given pie charts demonstrate the proportion of water usage for various reason in 6 parts of the world. In overall, four nations tended to use water for agriculture, two nations used for industry.
Speaking of the Europe and the America, Europe and North America showed similar trend, the highest use was industrial at 48% and 53%, respectively. Water in both area used 39% and 32% for agriculture, and left ratios were for household at roughly 15%. South America was different to them, only 10% of water used for industry. The highest ratio was agricultural use at 71%, and 19% of water used for household.
Moving to the Asia and the Africa, those area showed the highest water usage for agriculture. All area used water for agriculture more than 80%, and Central Asia showed approximately 90%. industrial, and domestic uses were less than 20% in total, and in Central Asia, only 5% of water used for industry.
157자, 20분
작문 해놓은 것과 글 올리는 것과 시간차가 있습니다
피드백을 받아도 계속되게 같은 실수가 많이 보일 것 같아요
그리고 캠브릿지를 테스트 1~4 순으로 푸는데 올리는 순서도 4~1이며, 다른 권이며 뒤죽박죽입니다..
어쩌면 시간이 지나도 나아지는 모습이 안보일 수 도 있지만 확실히 이클립스님 덕분에 동기부여와 멘탈 잘 붙잡고
목표 잊지 않고 노력하게 되어요! 결과적으론 분명히 나아지고 있을겁니다!
그럼 오늘도 잘 부탁드립니다!

 댓글 0개
댓글 0개


 불편사항 신고