


 인쇄
인쇄


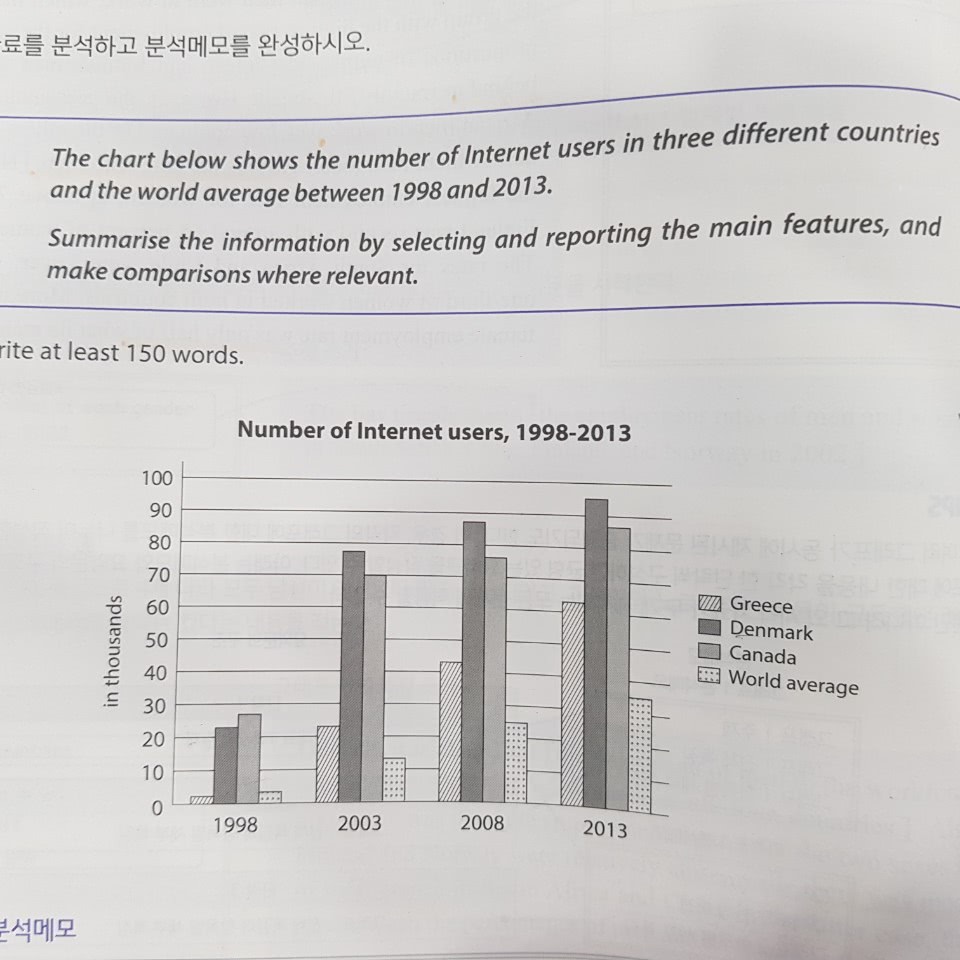
The bar graph gives information about the number of Internet users in Greece, Denmark and Canada from 1998 to 2013 alongside the world average for those years. Overall, all countries witnessed upward trends in the number of Internet users throughout the period.
As it can clearly be seen, The the figures for Denmark were consistently higher than the others since 2003 to 2013, after surpassing that of Canada in 1998. The users of the Internet in both Denmark and Canada were under 30,000 in the beginning of the period. However, both figures soared significantly in 2003, at about 78,000 and 70,000 respectively. The figures continued to increase until the end of the period in 2013, reaching about 95,000 and 8,000 (숫자 틀리지 않게 주의해주세요!).
In 1998, the number of Internet users in Greece was the lowest, being lower than the number of the world average. However, the The figure climbed dramatically from 1998 to 2003, and continued to increase by about 20,000 new users every 5 years. Even though the number of Internet users increased globally as well, but the figure was twice as lower as the figure for Greece from 2003 to 2013.
총평: (7/7/6/6) 6.5
내용 분석 잘 해주셨고, 문장 구조도 나름은 잘 패러프레이징이 되었습니다. 그러나 이에 비해 단어 사용에서는 조금 아쉬운 모습이 있었고요. number/figure 등의 표현이 너무 많이 쓰이지 않도록 주의해주세요! 이 글로만 봤을 때 김먹수님은 영어 실력이 어느정도 되시기 때문에 충분히 모범답안을 소화할 수 있는 능력이 있으십니다. 고로 특히 task 1에서는 모범답안을 많이 보시고, 그 표현들을 잘 분석해서 내 것으로 만들어주세요~수고하셨습니다 :)
(20분 189자)

 비밀번호 확인
 댓글 0개
댓글 0개


 불편사항 신고