


 인쇄
인쇄


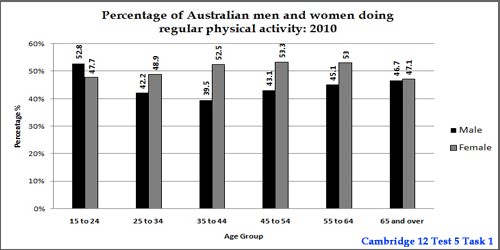
The bar chart below show the percentage of Australian men and women in different groups who did regular physical activity in 2010.
The illustration represents
that rate of how much the regularly exercising Australian male and female
change in 2010 by dividing different generations.
Overall, the proportions of
the female who was exercising were
nearly 50% over the ages shown in the chart, while the those of male shows more
dramatic differences compared to the female according to the generations in
2010. Also, generally female worked out more than male, except for the youngest
male generation.
The most active generation
in the female group is middle-aged people between 35 and 64 over 50%. Out of
the three groups, the figures in a 45 and 44-year-old female who worked out on
a daily basis were the highest with 52.3%.
In terms of male groups, the
most minimal rates of exercising people were from 35 and 44-year-old male with
39.5%. Compared to the female who is the same age group, the proportion of
female group was higher than the male by nearly 12 %, which is the most
significant gap between men and women.
Unlike
the most significant gap mentioned above, the figures in the oldest group
seemed the same proportion, regardless of gender. Also, in the youngest group,
the percentages of the male was higher than female by approximately 5%.
18분/ 207자

 댓글 0개
댓글 0개


 불편사항 신고