


 인쇄
인쇄


Task 1은 처음써봅니다
단어수 184
목표 점수 6.5
시험기간 3월 말, 5월 중순, 총 2번
시간 : 30분
도움없음
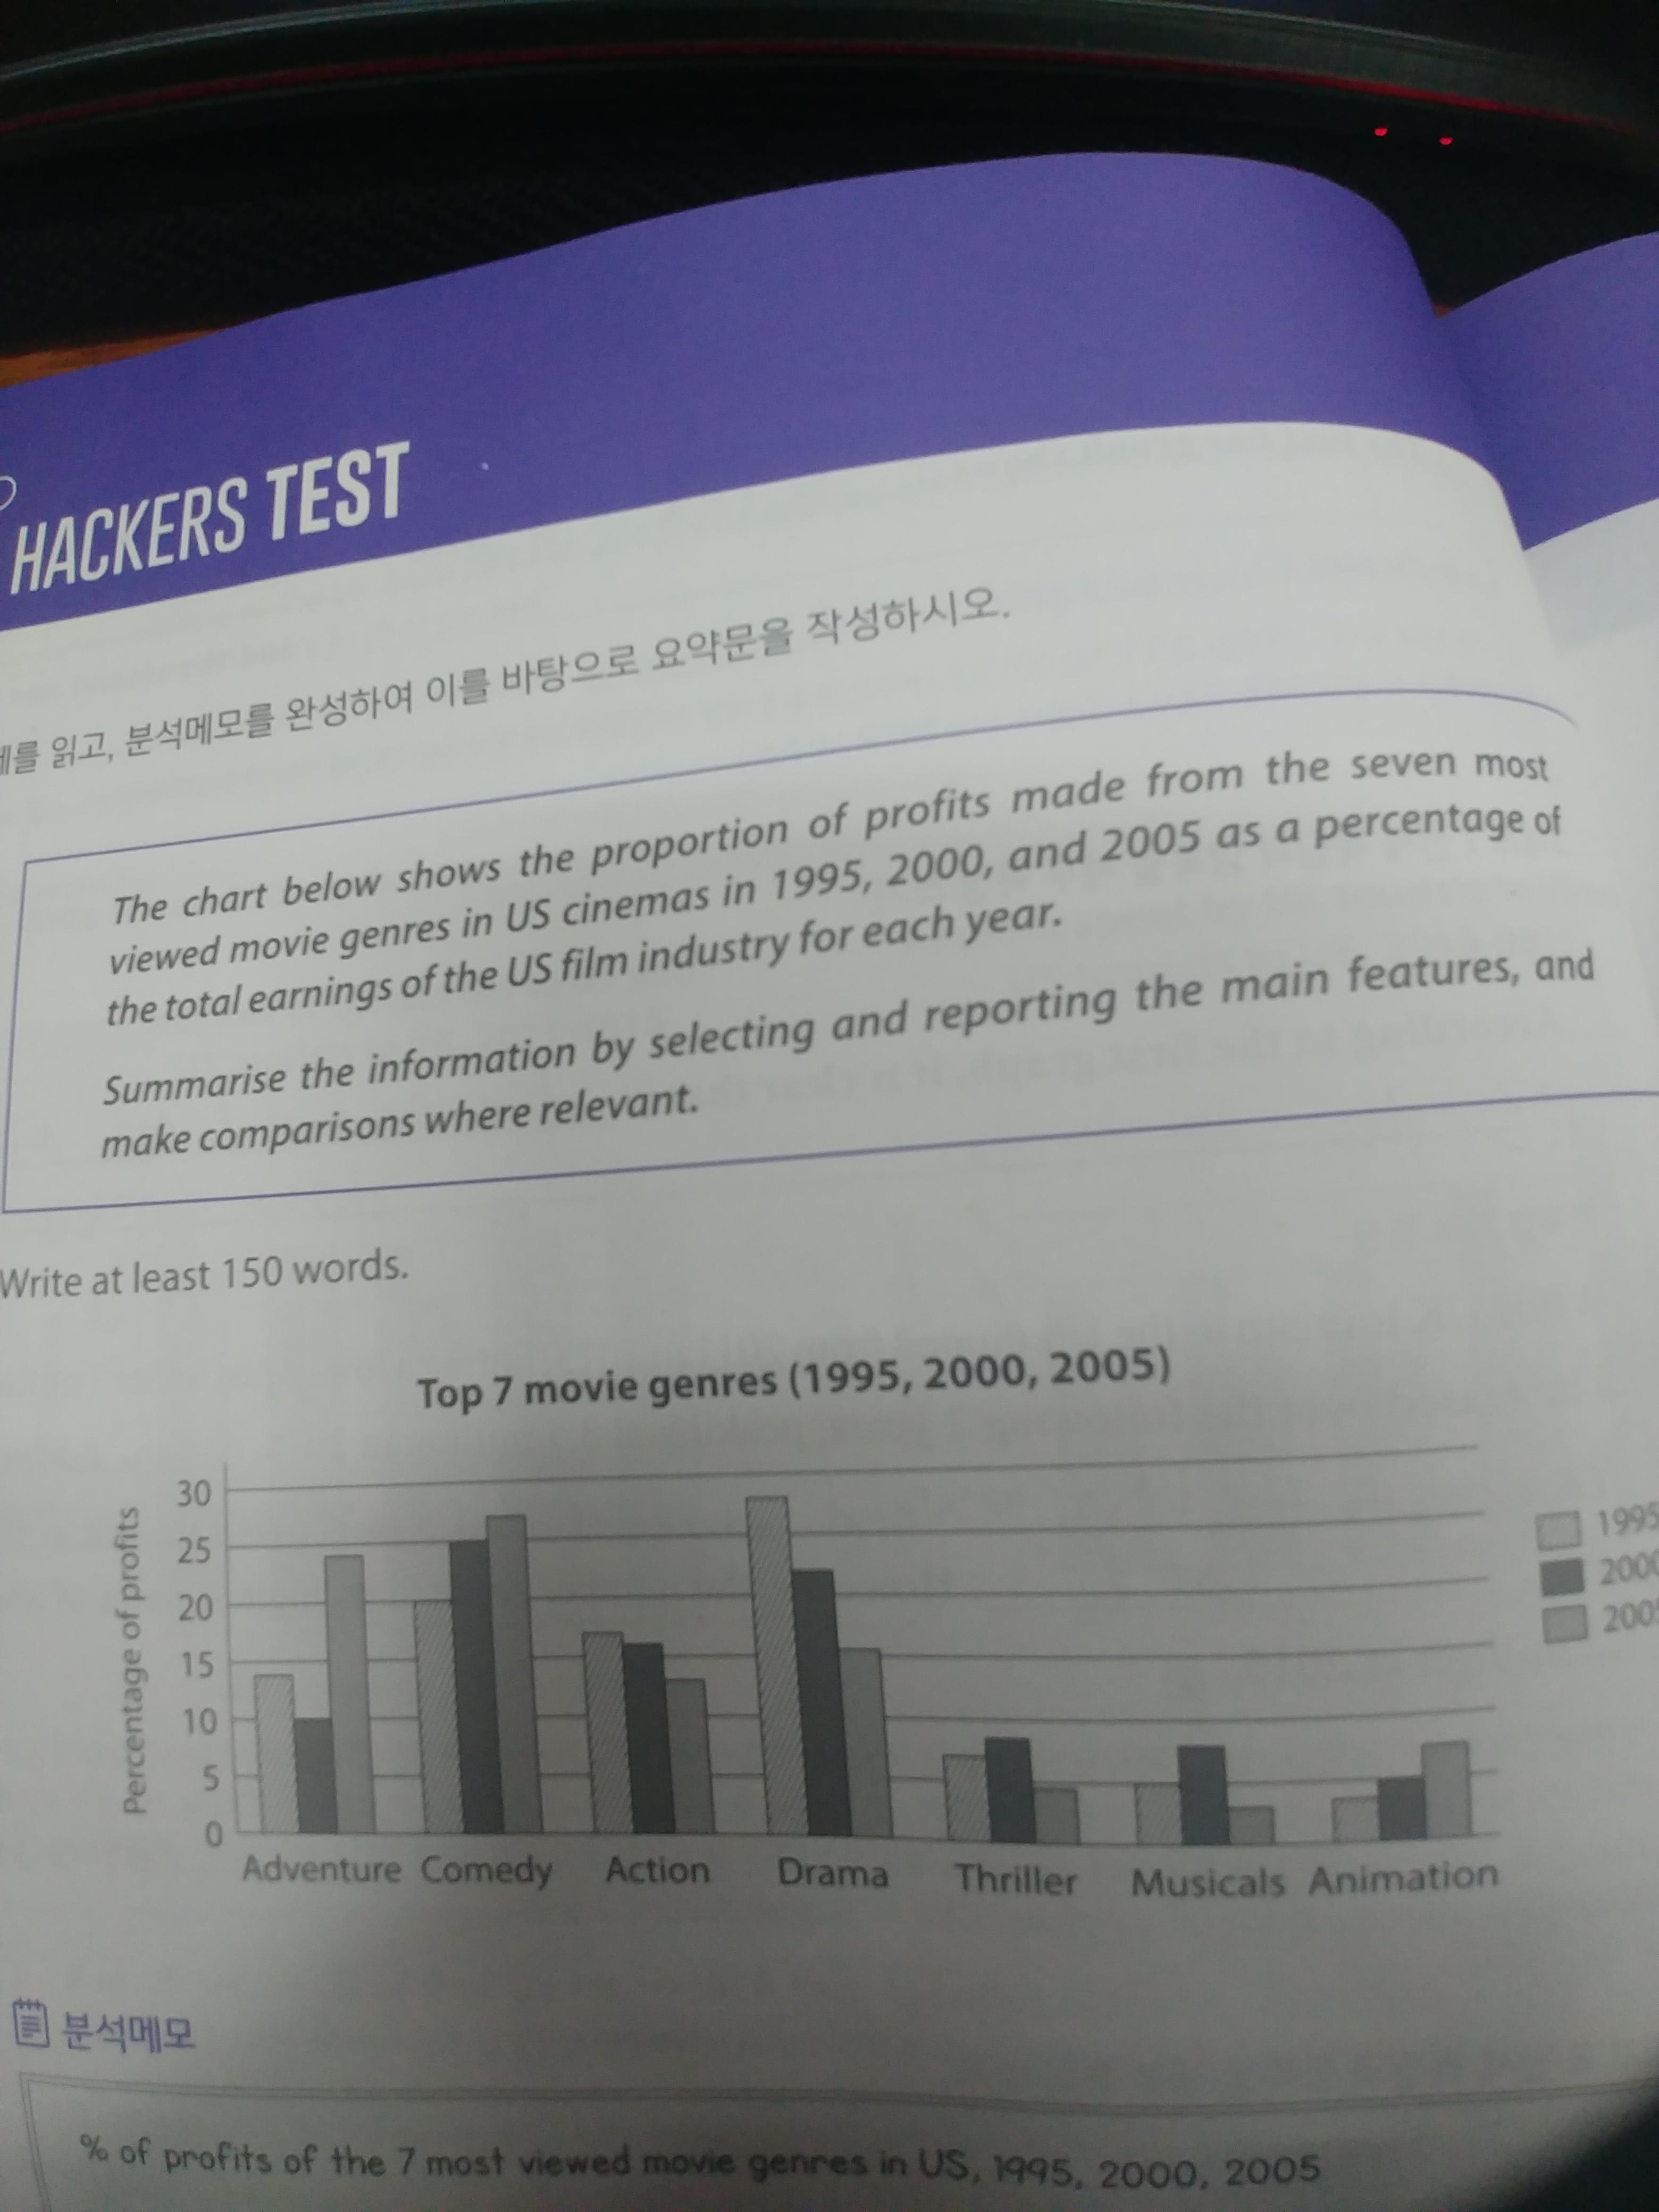
The bar chart is that the sales percentage of 7 different movie ganre in US every 5 year from 1995 to 2005.
The most noticeable feature in the chart is that Adventure, Comedy, Action, and Drama were the dominant of movie ganres, The total percentage of them accounted for approximately 70% and each ganre of that took up over 10% over the period in question, whereas Thirller, Musicals, and Animation had only 3-8%. It means the former ganres were more popular and profitable movies than the latter ganres for 10 years.
Looking at the graph more closely, one can see that the highest point of percentage of profits was Drama, peaking at 27%, and then fellow by Comedy at 20%, Action at 16%, and Adventure 14% in 1995. The most profitable movie in 2000 was comedy, increasing almost 10%. On the other hand, drama had the largest reduction by 10% and recorded 22%. In cases of unprofitable moves, the percentage of that increased about only 2-3%. Lastly, In the end of period in quest, Adventure and comedy, Animation increased compared to the before, peaking at 24%, 27%, and 7%.

 댓글 0개
댓글 0개


 불편사항 신고