


 인쇄
인쇄


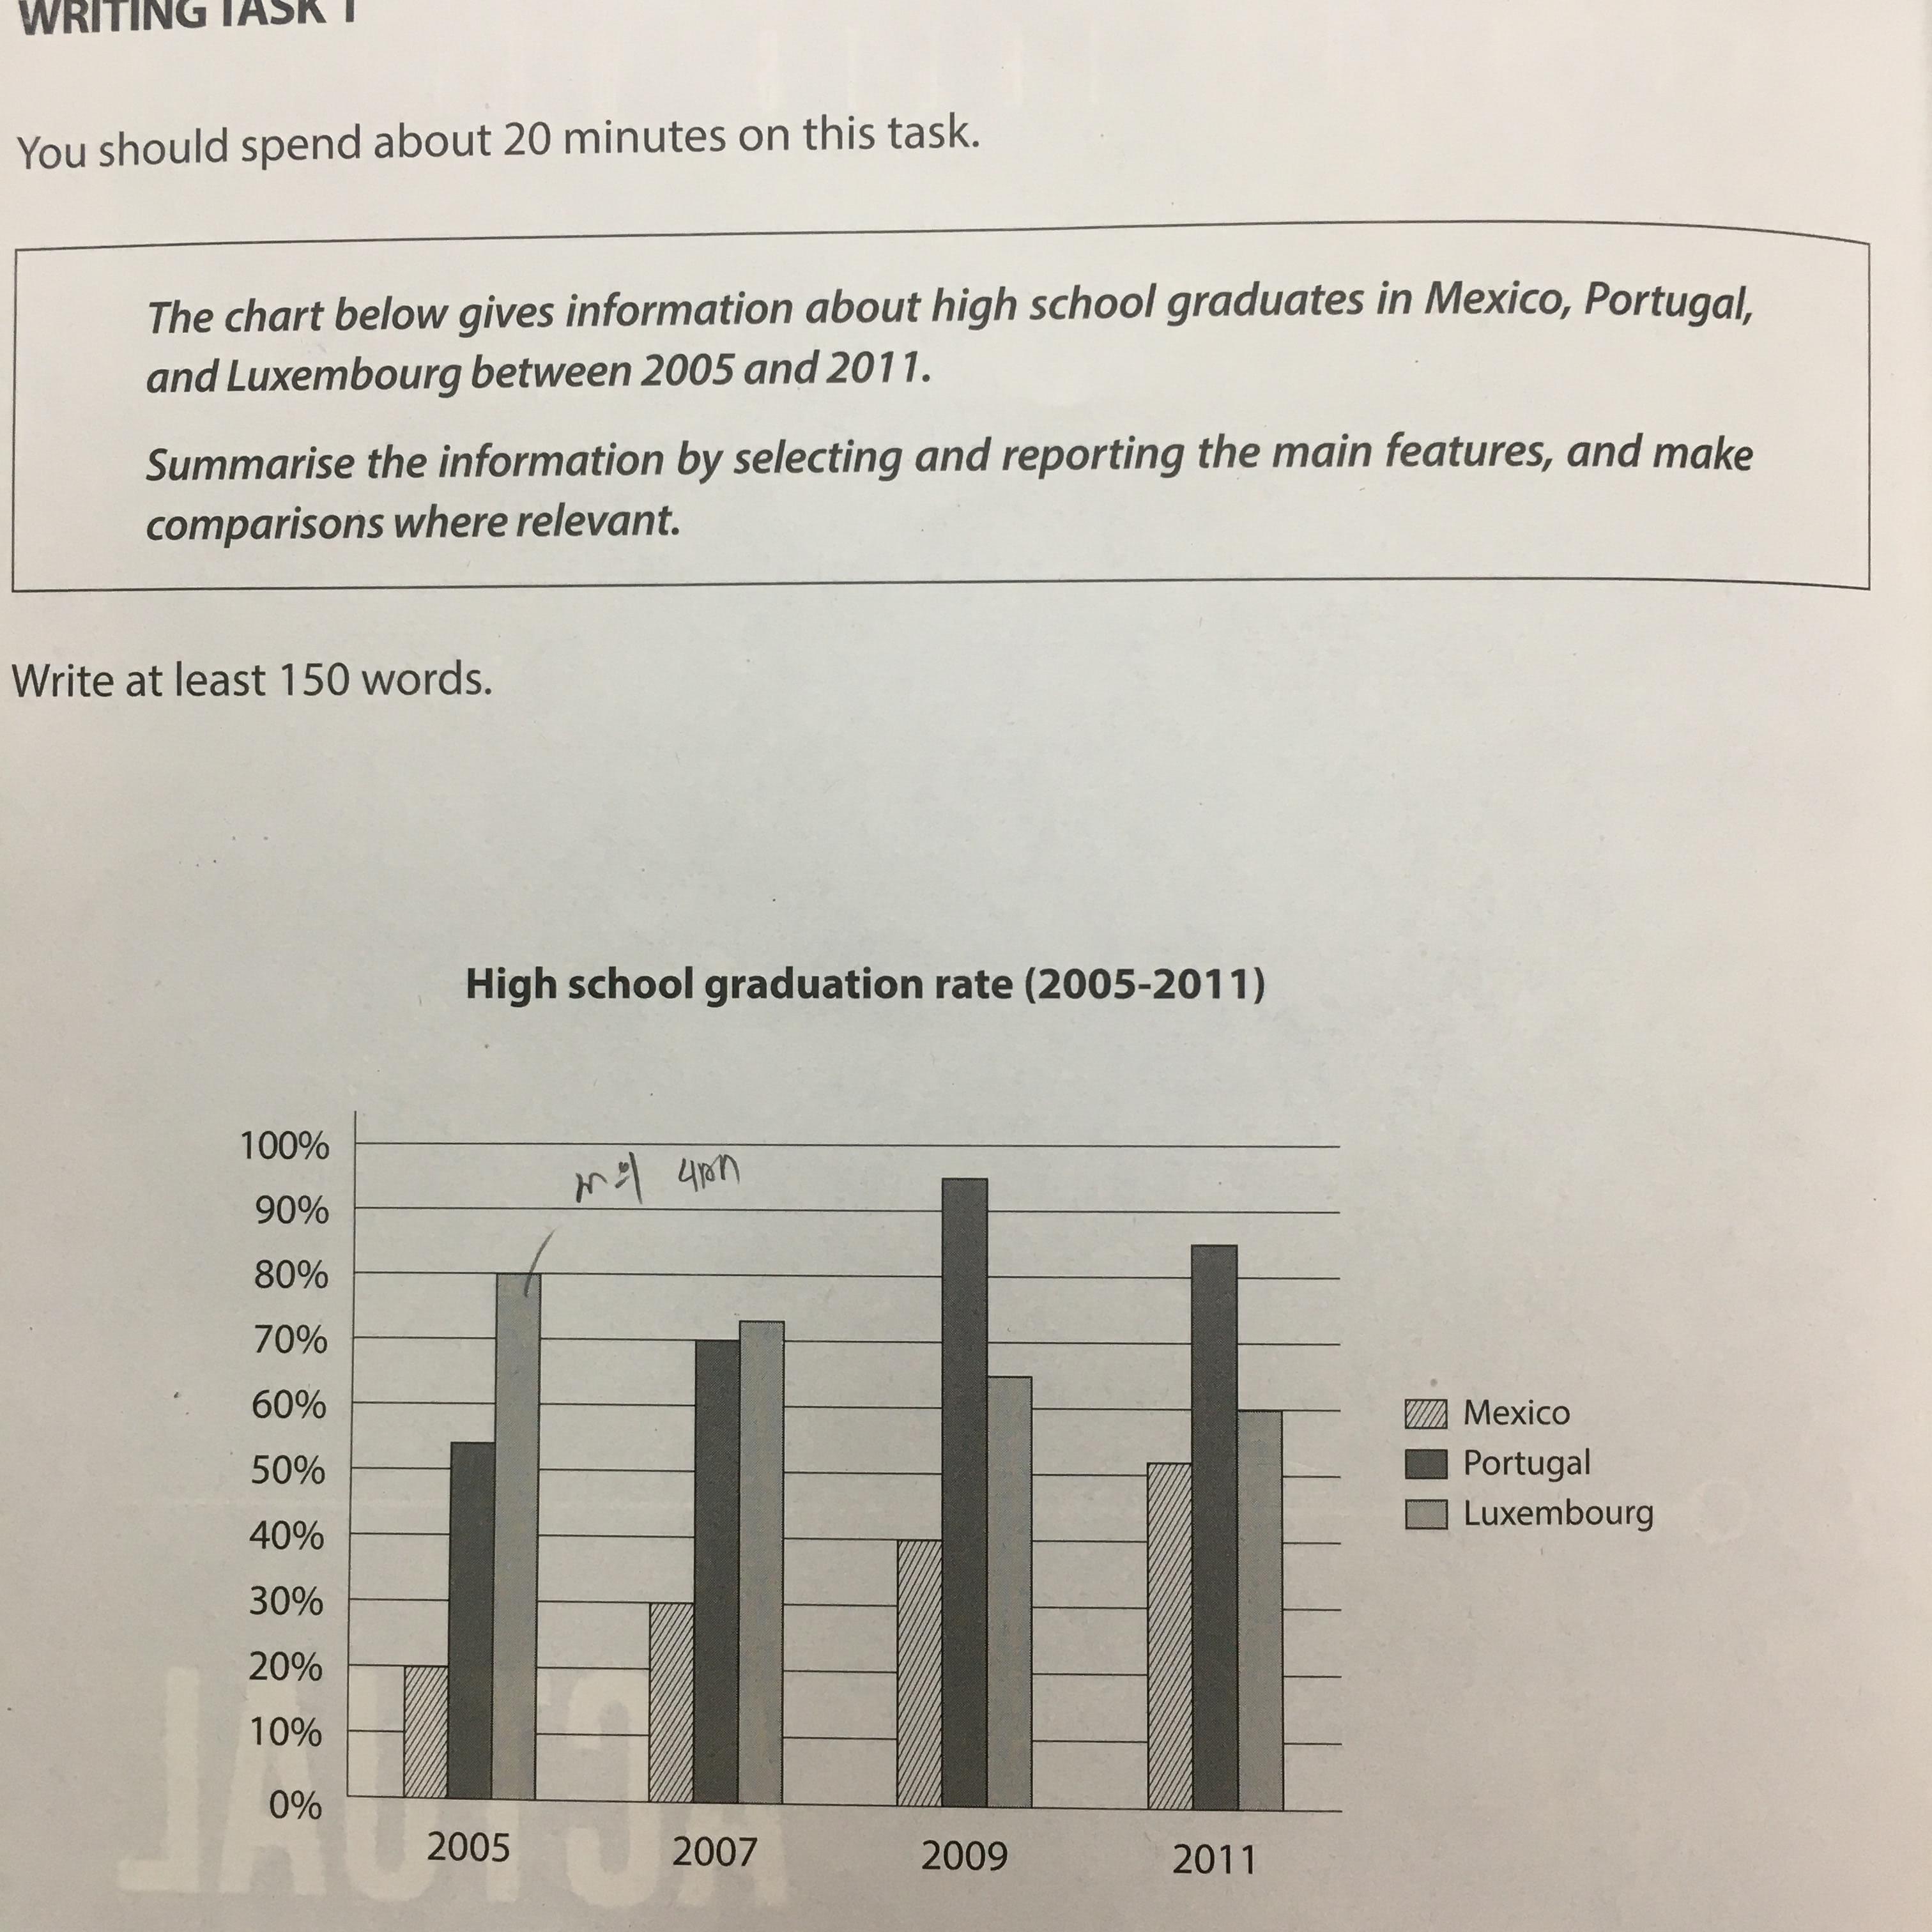
The bar graph illustrates the percentage of graduates in high school in Mexico, Portugal and Luxembourg in the year 2005, 2007, 2009 and 2011. (묶어서 서술해주시는 게 낫습니다. 굳이 나열할 필요는 없어요.)
All
in all, it is apparent that and Portugal mostly showed an upward trend in graduation rate.
However, although there is a consistent increase in Mexico, it always has
recorded the lowest rates of graduates during all years in question. In
contrast, that of Luxembourg portrayed a downward trend.
Firstly,
one can see that in 2005, there is the highest graduation rate in Luxembourg at
80%, which is quadrupled of Mexico's proportion of high school graduation.
However, its rate has dipped gradually for the rest of the years to 60% by
2011. On the other hand, Portugal has remained as the country showing the second highest rate of
graduation in 2005, which experienced a dramatical surge by 2009 to 95% and also
surpassed the figure of Luxembourg. After that, there is around 10% (여기는 퍼센트포인트로 표시해주셔야합니다.) decrease by 2011. in In the
case of Mexico, though it has logged the lowest percentage of graduates, it
rose steadily over the years, which noted more than 50% in 2011.
총평: (7/6/7/6) 6.5
어색한 표현들이 보이기는 하나, 대체로는 잘 써주신 편입니다. 여기서 시간+그래머리에 따른 감점이 얼마나 될지가 관건인데, 개인적으로는 그래도 6.0은 받을 수 있을 것으로 봅니다. 이전에도 말씀드렸듯이 잭슨님은 문법에서 크게 문제가 없으면 6점은 넘기시므로 최대한 정확성, 신속성(=시간) 에 집중해주세요~수고하셨습니다 :)

 비밀번호 확인
 댓글 0개
댓글 0개


 불편사항 신고