


 인쇄
인쇄


|
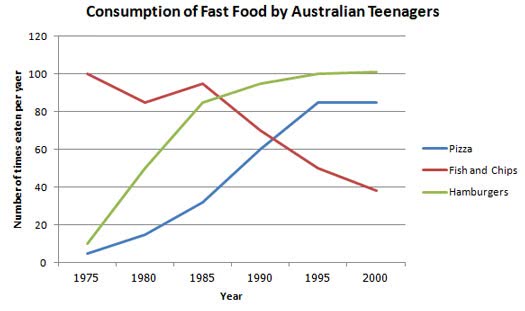
You should spend about 20 minutes on this task. The line graph below shows changes in the amount and type of fast food consumed by Australian teenagers from 1975 to 2000.Summarize the information by selecting and reporting the main features and make comparisons where relevant. Write at least 150 words. |
|||
|
The given line chart illustrates the consumption number of three different types of junk food Australian adolescents had from 1975 to 2000. All in all, while the popularity of fish and chips had been declined, the demands of hamburgers and pizza had been increased throughout the supplied years. Firstly, the number of hamburgers’ order had drastically surged for the first ten years, more than fourfold as high as that of the first year by 1985 before it gradually grew up by nearly 20 times from 80 times until the end. Secondly, pizza had steadily gone up in consumption (이걸 꼭 넣어서 의미가 정확하게 전달되도록 해주셔야 합니다.) for twenty years by hitting the peak, in 1995, eight times Although the number of fish and chips’ consumption slightly went down from 82 to 100 initially, it was the most popular choice among the fast foods for the first ten given years. Nevertheless, the number of ordered hamburgers became the first choice from the latter period of 1985, subsequently, the number of consumers who ate pizza in 1990 overtook the second-highest. Hence, due to the remarkably demolished (의미 자체가 너무 강해서, 여기에 쓰이기에는 적절하지 않습니다.) number of Fish and Chips (소문자 시작입니다.) fans (패러프레이징하려다가 굳이 여기까지 가실 필요는 없습니다.), it ended fewer than 40 times of order request.
|
|||
|
[ 198 words] |
|||
|
Grammar |
Vocabulary |
Cohesion
and Coherence |
Task
Response |
|
7/9.0 |
7/9.0 |
7/9.0 |
7/9.0 |
총평: number 라는 단어 자체가 많이 쓰이는 것과는 별개로, 대부분의 문장들이 이 단어가 중심이 되어서 서술되어있는 상황이라 이에 대한 타개책이 필요합니다. 문장을 the number of~~로만 구성하는 것이 아니라, 구조 자체를 가끔은 확 틀어주실 필요가 있어요.
꽁치님은 모범답안을 소화할 실력이 충분히 되는만큼, 특히 task1에서는 모범답안이 어떠한 구조로 이루어져있는지를 파악한 뒤에 그 문장구조와 표현을 내 것으로 만들어주세요~
수고하셨습니다 :)

 비밀번호 확인
 댓글 0개
댓글 0개


 불편사항 신고