


 인쇄
인쇄


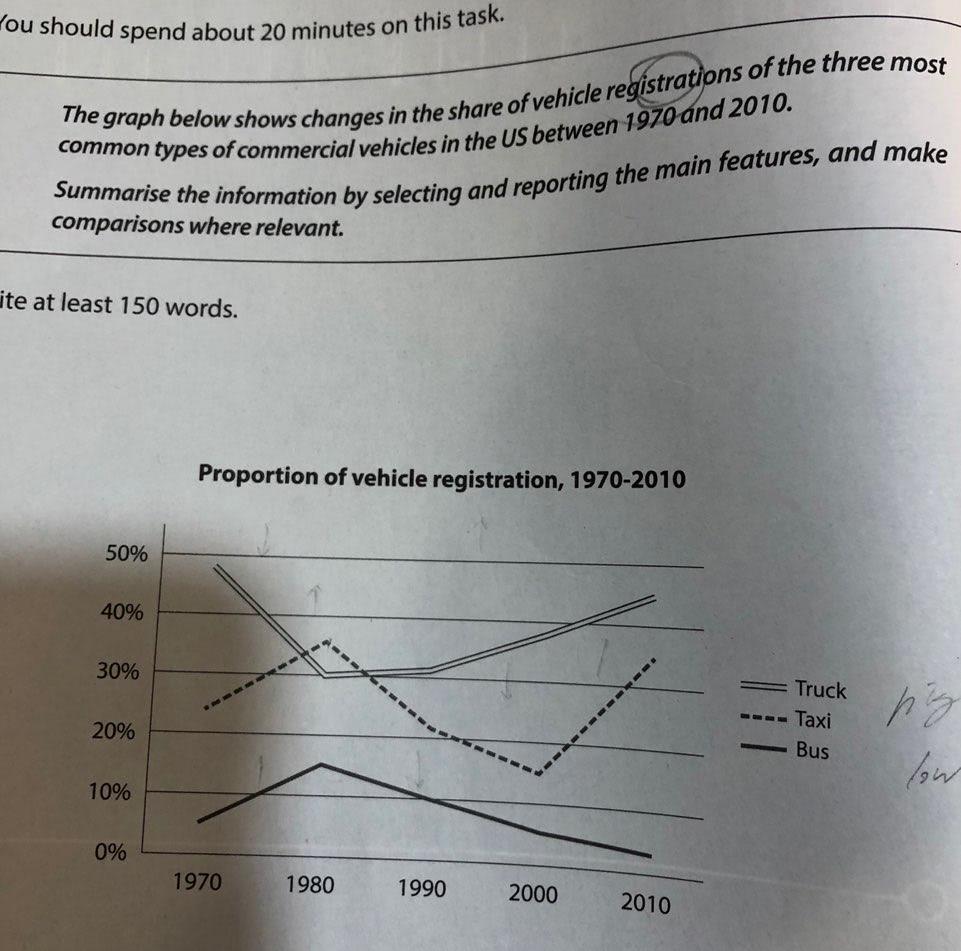
The graph represents the percentage of vehicle registrations of the three most common types of commercial vehicles in the US between 1970 and 2010.
Overall, it is clear that the percentage of the truck is the highest among that. However Meanwhile (한국어로 각각 '그러나' 와 '이에 비해' 를 넣어보시면 금방 감이 오실 겁니다.), in the case of the bus it represents the lowest percentage during that period.
First of all, the portion of the truck increased continually so it kept keeps the head position. While the first two decades years, in 1970 and 1980, it dropped by almost 20 percents (여기는 퍼센트포인트로 써주셔야 합니다. 이에 대해서는 총평에서 링크를 넣어드릴게요.), the percentage of the taxi increased and occupied the first position first and last. However, after that the taxi percents had change pace, going up and down. Lastly, in the case of the bus, it also had a change in pace but steadily maintained maintains the lowest percentage.
총평: (6/6/6/5) 6.0
현재 제일 큰 문제는 분량이 부족하다는 것으로 보시면 되겠습니다. 눈대중으로 봐도 대략 120~30자 밖에 안 되는데, 남은 30자 가량을 어떻게든 채워주셔야 해요. 저는 분량에 따른 감점은 따로 하지 않지만, 실제 시험에서는 150자에 미달될 경우 감점이 있기 때문에 지금은 사실 6.0보다는 5점대로 보셔야 맞습니다.
구체적인 수치를 적시하는 방식이 제일 쉬울 것이므로, just under 50% 등이 표현을 넣어서 분량을 꼭 채워주세요!
수고하셨습니다 :)
https://www.gohackers.com/?c=ielts/ielts_info2/ielts_method&type=url&uid=486596

 비밀번호 확인
 댓글 0개
댓글 0개


 불편사항 신고