


 인쇄
인쇄


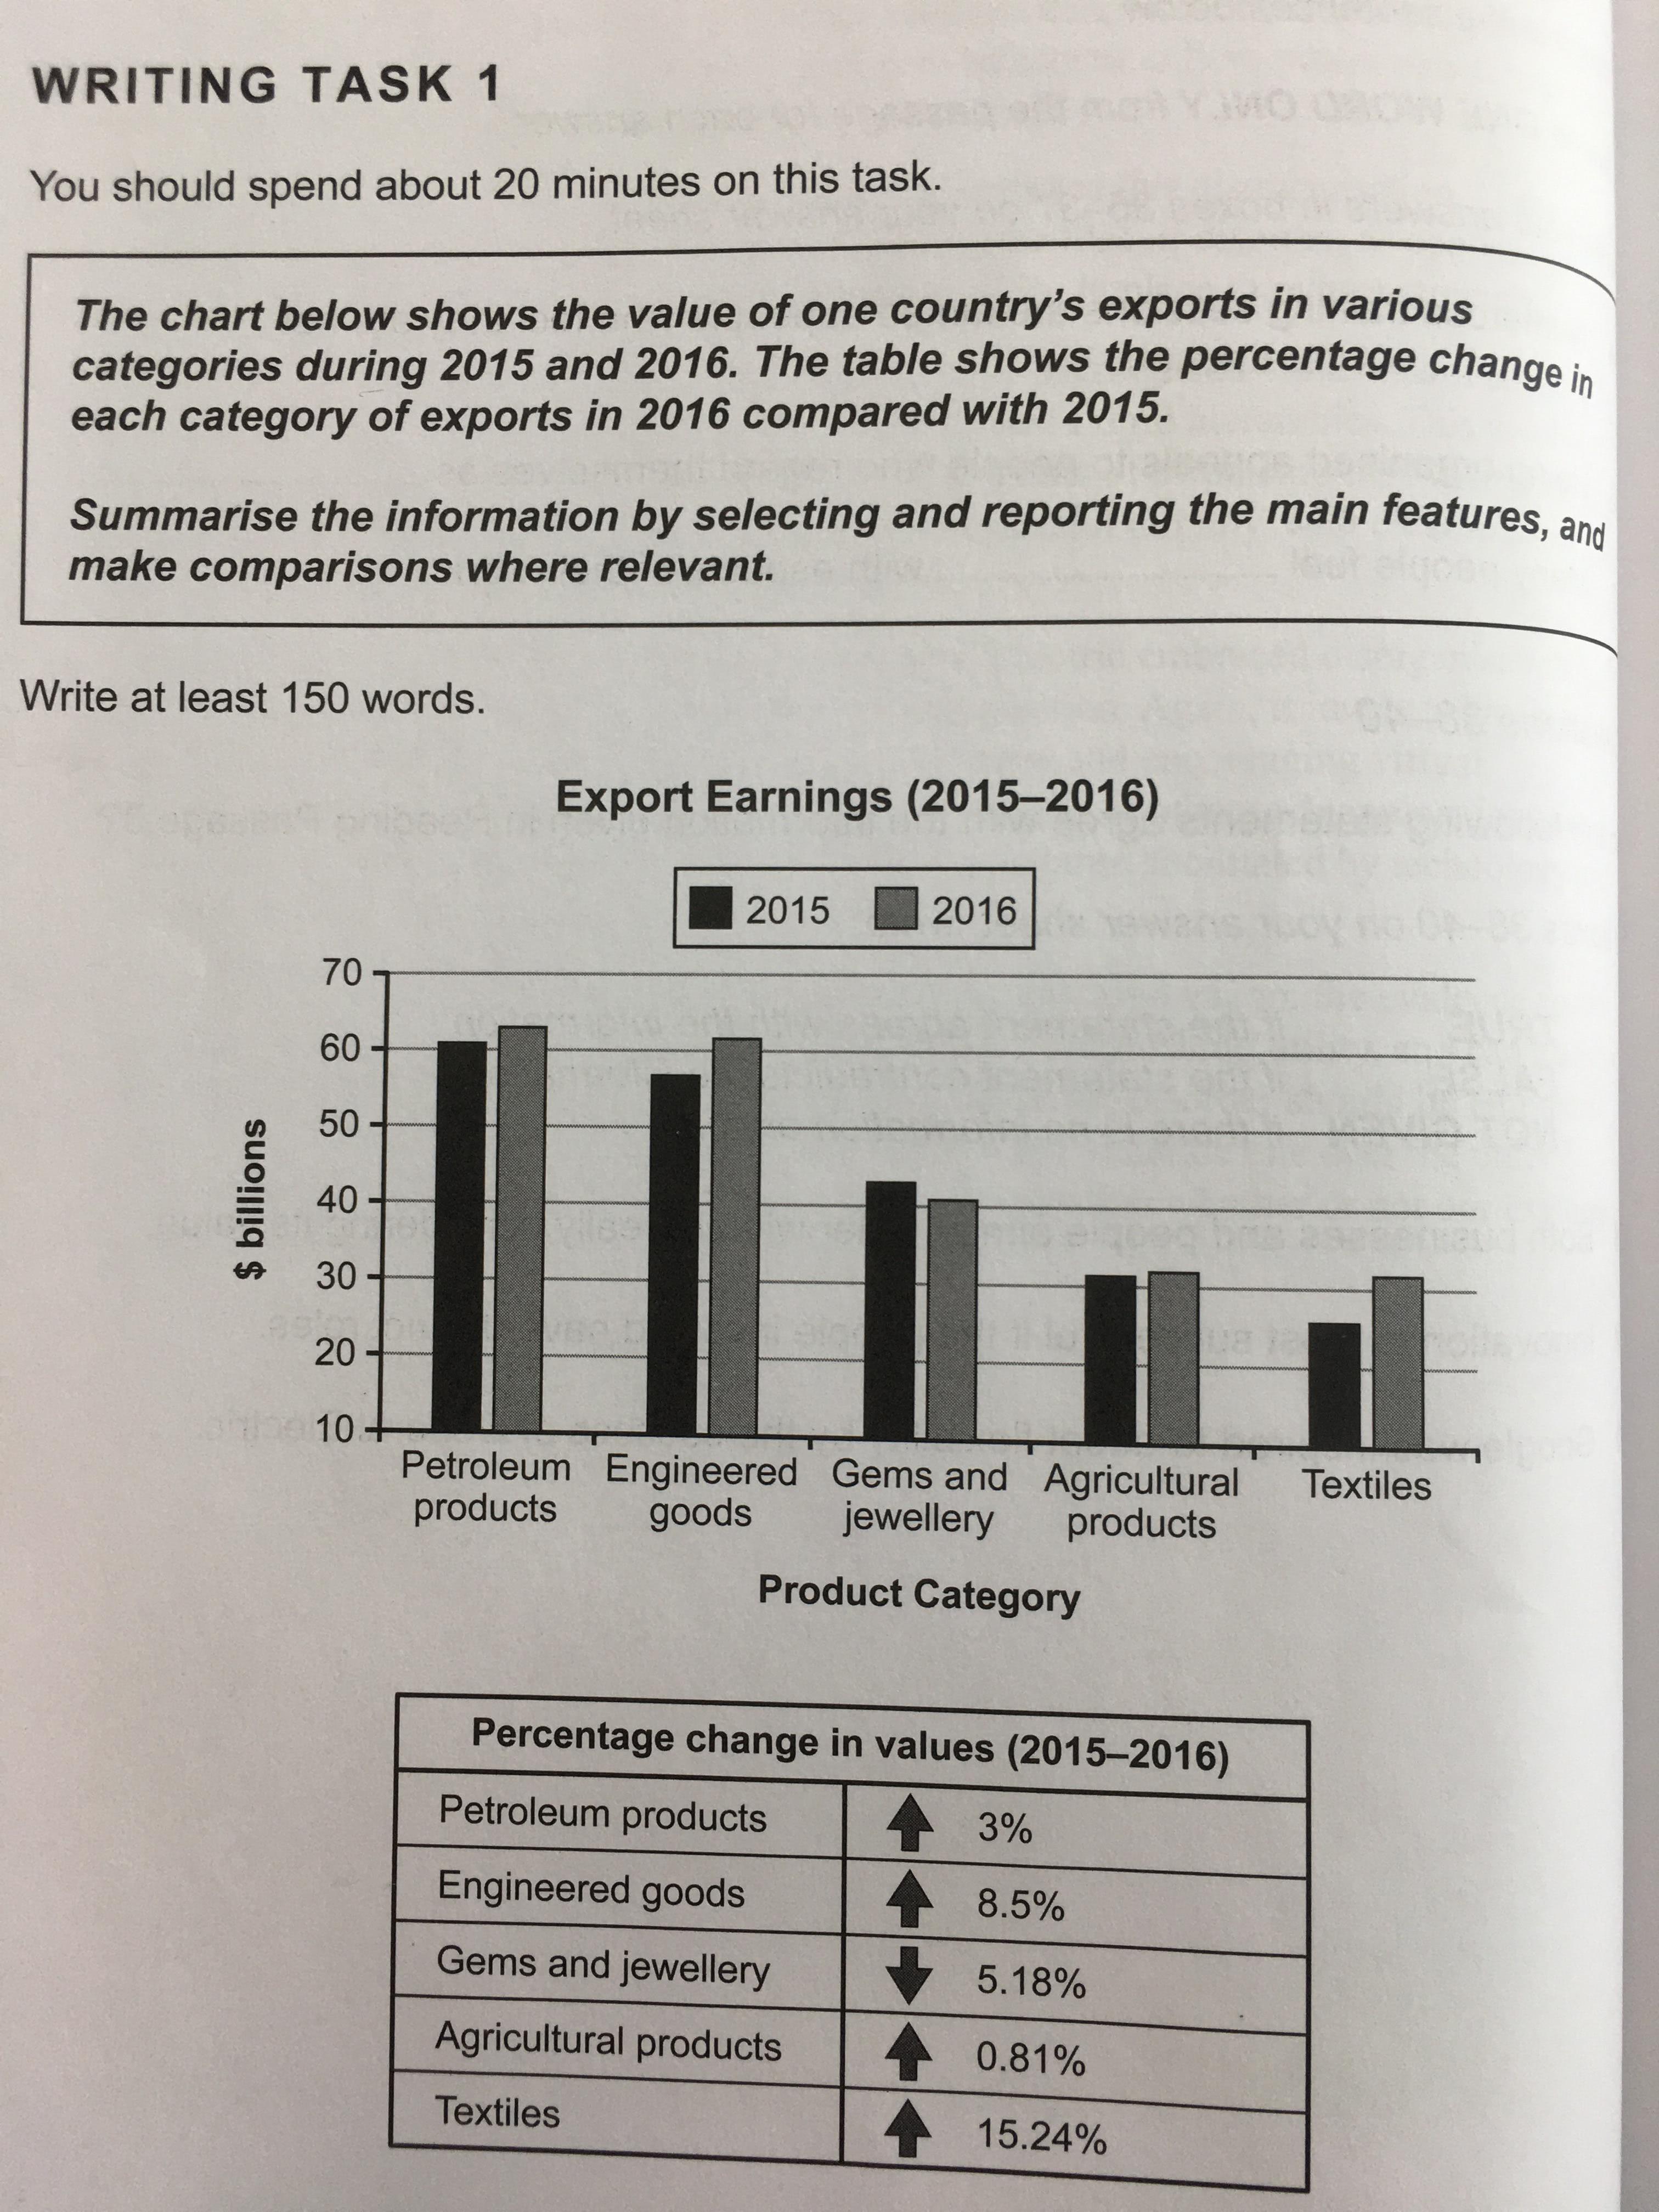
The bar graph illustrates the export incomes in a nation through diverse categories in the year 2015 and 2016 and the table chart indicates the proportion of alteration of income in each category between 2015 and 2016.
All in all, most products showed the upward trend of the percentage change in values, whereas only the export of gems and jewellery is demonstrated the downward trend. Particularly, thee is the highest per cent increase in Textiles.
Looking at the bar and table more closely, one can see that petroleum products are logged approximately $60 billion values of export in 2015 and 2016, there is 3% improvement in income. Meanwhile, agricultural products recorded a slight increase in percentage as 0.81% to just above $30 billion' income from 2015 to 2016. In contrast, there are two significant rising in engineered goods and textiles, which rose 8.5% and 15.24% by from nearly $55 billion to more than $60 billion and from around $25 billion to higher than $30 billion respectively. On the other hand, export earnings of gems and jewellery are decreased as 5.18%, which noted much more than $40 billion in 2015, while in 2016 its values exported just almost $40 billion.

 댓글 0개
댓글 0개


 불편사항 신고