


 인쇄
인쇄


1. 목표하시는 점수,
목표 점수는 5.5 인데..제가 시간내에 쓰는 연습을 한번도 안해서 첫시험때 라이팅이 5.0이 나왔습니다ㅜㅜ
여기서 첨삭을 받았을때는 처음에 5.5에서 7.5까지 나왔었는데 아무래도 제가 시간을 재고 적지 않아서 그런거같아요.
2. 다음 시험 예정 날짜,
2.18일에 두번 째 시험을 예정하고 있습니다!
3. 이전에 시험을 치렀을 경우 그때의 점수,
5점을 받았구 타스크 1,2 둘다 글자수를 못채웠어요..그래프를 보면 처음보는 단위이거나 하면 패러프라이징 하는데도 헷갈리더라구요..
4. 현재 글을 시간을 재고, 아무런 외부의 도움 없이 작성했는지의 여부
15분동안 시간을 맞추고 쓴 후에 이후 15분동안 다시 수정하였습니다(ㅠㅠ). 외부의 도움 없이 썼습니다!
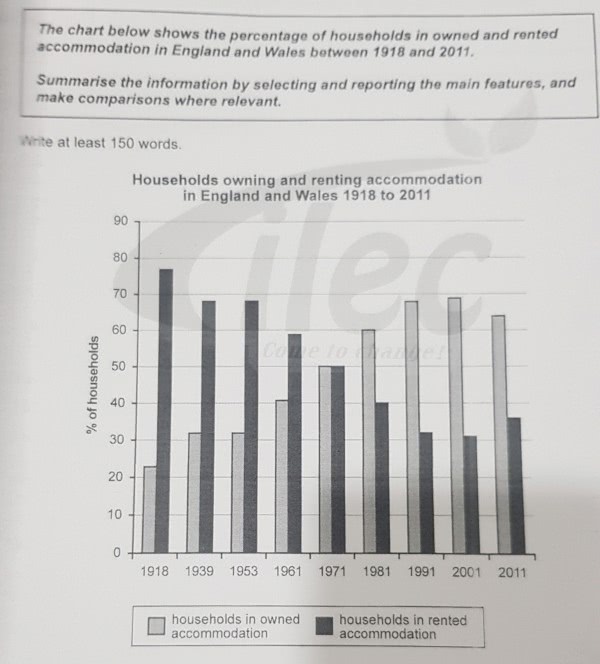
The bar graph exhibits how many families lived in owned house or rented accommodation in England and Wales from 1918 to 2011.
It is noticeable that the percentage of families lived own house increased steadily over the given period except for in 2011. Whereas the number of households who lived in rented house declined over the same period, likewise, apart from 2011.
Looking at the details, the fewest families lived in their own house by 1918, accounting roughly 23%. In contrast, almost eight out of ten families lived in rented house, which was highest figure. Over the next thirty years, the figure for households who lived in their house went up to approximately 32%, and around 68% was recorded in families who lived in rented house during the same period.
Interestingly, half of the households lived in their house and rented house respectively in 1971. After 10 years, the figure for families who lived in rented house outpaced figure of the other category. From 1991 to 2001, two type of categories showed gradual changes only by 1% respectively. In the final year, two-third of the households lived in owned house while about 36% lived in rented house.

 댓글 0개
댓글 0개


 불편사항 신고