


 인쇄
인쇄


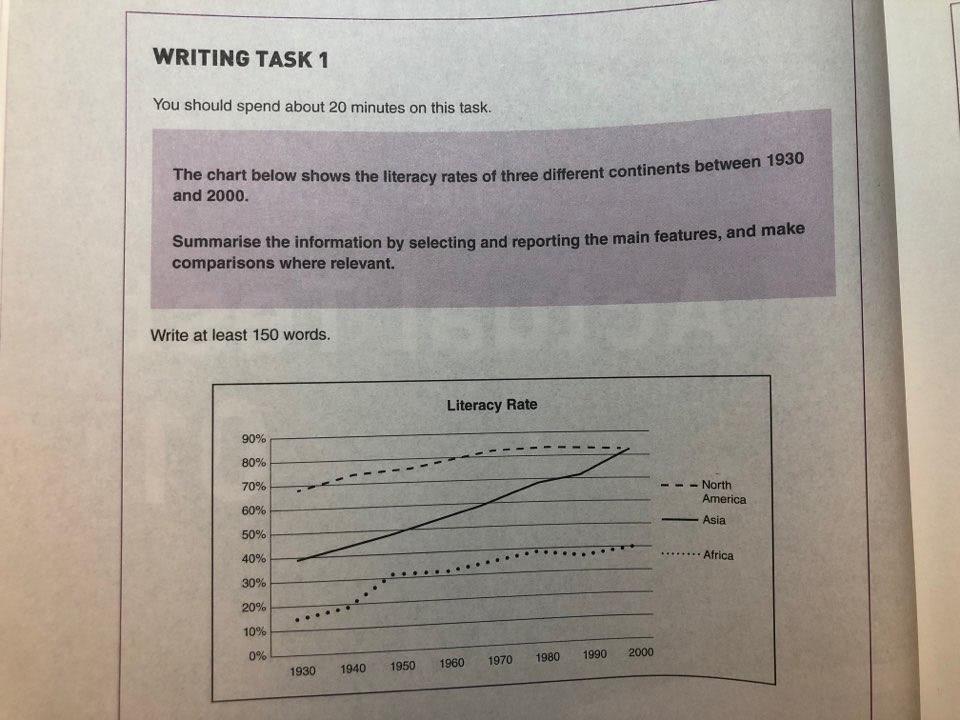
The Line graphs show the proportion of the literacy in North America, Asia, and Africa from 1930 to 2000.
Overall, it is clear that North America had the highest literacy rate till just before 2000. It is also observed that growth in the literacy rate had consistently increased in Asia in all period. While the proportion of literacy in North America had decreased a bit after 1990, Asia had still increasing pattern.
Looking at the chart more closely, one can see that North America had 70 percent of literacy rates which is the highest, following by Asia at 39 percent, and Africa at 13 percent. While the increasing rates slowed down in Asia from 1980 to 1990, North America and Africa had decreased around 1%. Then the literacy rates in Asia accelerated again and had overcome North America in 2000 with the proportion of almost 85%. Although the rates of Africa had roughly quadrupled from 1930 to 2000, it had still only about 41% of the literacy.
총 글자수: 167자
소요 시간: 20분
목표 점수: overall 7.0 이상
시험예정: 2월 말
라이팅은 인강만 보다가 처음으로 써보는데 쉽지 않네요...
미숙한 부분 일침 부탁드립니다.
라이팅 리스닝은 채점 해보면 평균적으로 7.0~7.5 나오는데, 라이팅 써보니까 한달안에 overall 7.0이상 바라보는거 헛된 꿈은 아닐까 걱정되네요..

 댓글 0개
댓글 0개


 불편사항 신고