


 인쇄
인쇄


Answer:
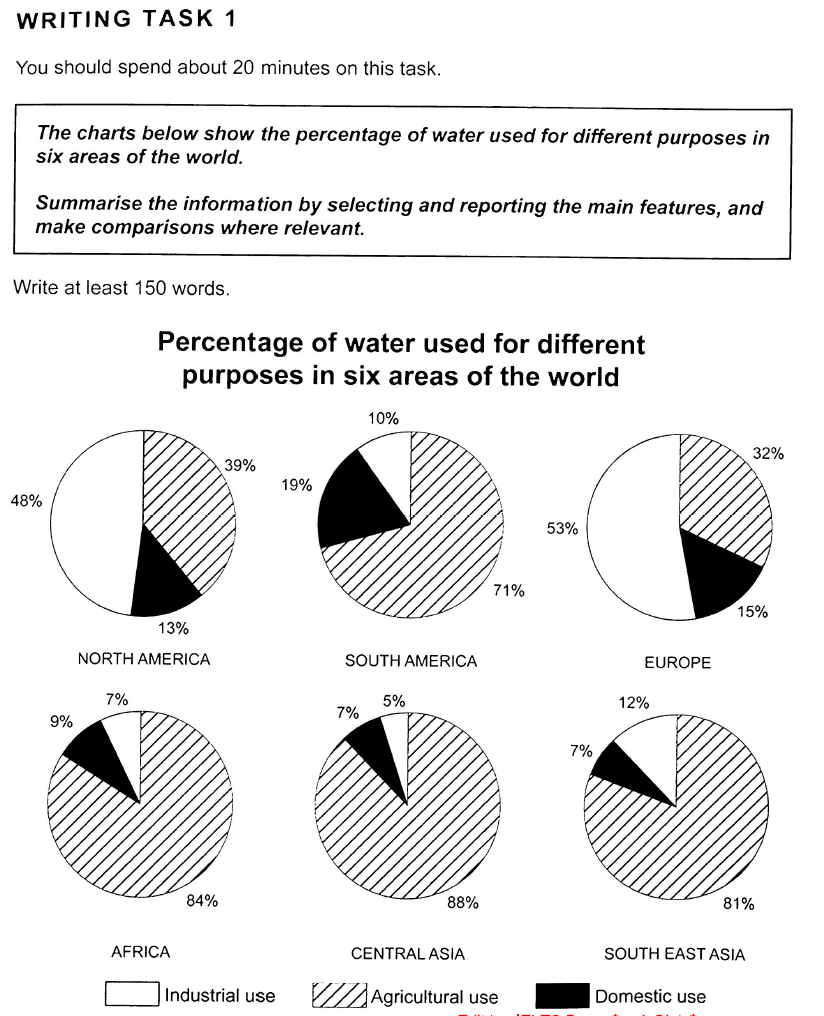
The charts shows the percentage of water
used for different purposes in six areas of the world. The purposes of the
water use are categorised according to three different purposes such as industrial
use, agricultural use, and domestic use. The water used for agricultural use
accounts for the largest portion in the areas of the world including South
America, Africa, Central Asia, and South East Asia while the use of water for industry
takes the largest part in North America and Europe. The use of water for
agriculture in North America and Europe is also significant compared to the one
for domestic use. The water used for domestic purpose shows the minimum portion
compared to other purposes except South America. It seems like that the rate of
the water used for different purposes are highly likely to depend on the degree
of industrialisation in each individual area of the world. This is may be the
reason why the water used for industrial use takes up the biggest part in the
areas such as North America and Europe since these areas are relatively
developed compared to other areas in the figure.

 댓글 0개
댓글 0개


 불편사항 신고