


 인쇄
인쇄


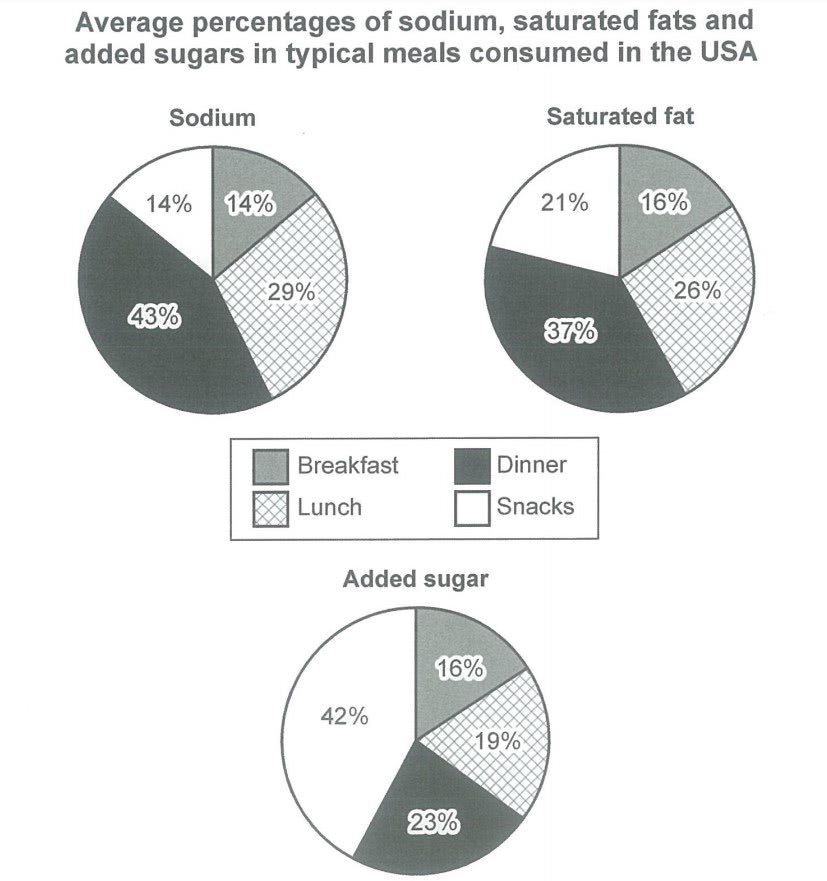
Each pie chart shows the average intake of sodium, saturated fat, and added sugar in percentage in common American meals. The pie charts indicate 3 nutrients in breakfast, lunch, dinner, and snacks.
Generally, all nutrients show high percentage in dinner, especially sodium is consumed the most in dinner - 43% and saturated fat - 37%. And followed by lunch, where sodium recorded 29% and saturated fat recorded 26%. Whilst added sugar was only consumed 23% in dinner, nearly half of added sugar - 42% - was consumed in snacks. It is noticeable that all three nutrients are consumed the least in breakfast - 16% of added sugar and saturated fat, and just 14% of sodium intake was shown in the pie charts.
Overall, in can be summarized that sodium and saturated fat is consumed the most in dinner then lunch, and added sugar is contained the e most in snacks in USA.

 댓글 0개
댓글 0개


 불편사항 신고