


 인쇄
인쇄


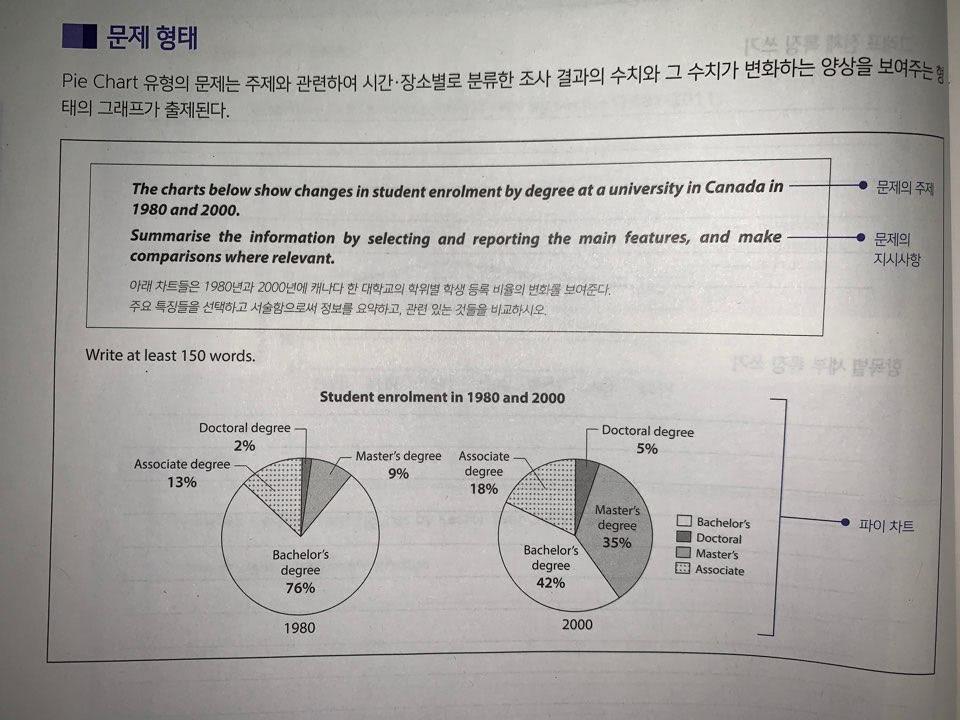
The pie chart shows the changes in student enrolment in year 1980, and 2000. In 1980, most of the enrollment that was made was mostly bachelor’s degree, followed by associate degree, and master’s degree. However in 2000, popularity of bachelor’s degree went down significantly, and other degrees showed an increase of their percentage.
To look at the graph more closely, in 1980, Bachelor’s degree was the largest group within 4, with 76% of enrollment. Second popular group was Associate degree, showing 13%. Next, Master’s degree was the third largest group, having 9% overall. Finally, Doctoral degree took the smallest amount of percentage, remaining only 2%.
Next graph in 2000, surprisingly, it is noticeable that Bachelor’s degree fell down to 42%. In case of Master’s degree, unlike Bachelor’s, it showed a dramatic increase almost up to 35%, which is about 4 times higher than back in 1980. Then the third place was followed by Associate degree, having 18% in total. Just like 1980, Doctoral degree was lowest of all, but it rose up to 5%, which is a 2.5 times higher than it was in 1980.
185 words
16 min
아이엘츠 시작한지 4일 정도 된 학부생입니다!
저는 목표점수를 7.0 정도 받고싶구요ㅜ
다음 시험 예정 날짜는 2월 중순에 보려고 합니다. 혹시 2월 중순에 시험보려면 언제쯤 신청을 하는게 좋을까요..?
현재 글은 저 혼자 작성한 것 이고요. writing에서는 7.5 정도를 받고싶습니다!
매번 열심히 첨삭해주셔서 정말 감사드립니다ㅜㅜㅜㅜㅜ

 댓글 0개
댓글 0개


 불편사항 신고