


 인쇄
인쇄


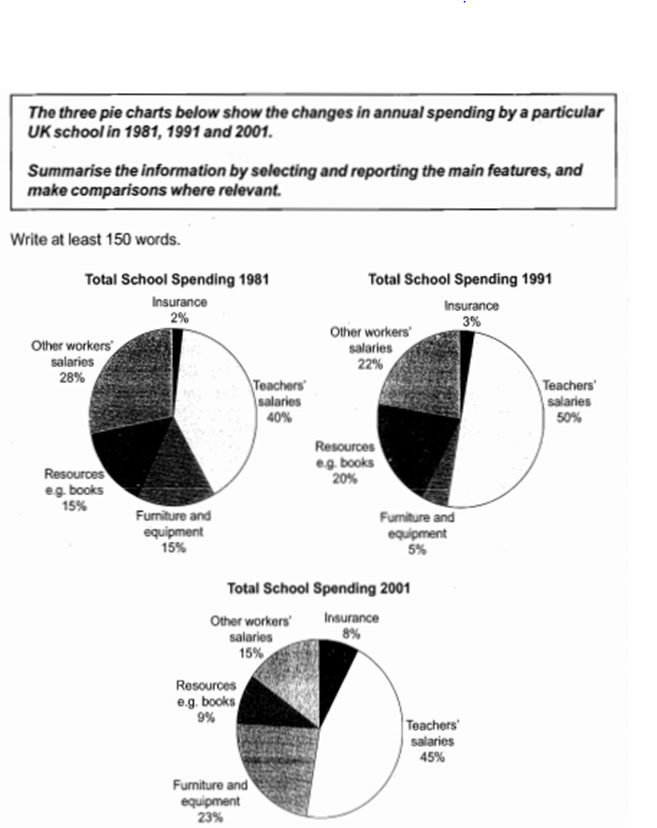
The three
charts give a information about annual expenditure of a particular school in UK
in 1981, 1991 and 2001.
Overall,
it can be seen that total spending in 1981 and 1991 showed similar trend, as
opposed to that in 2001 with several significant changes. At the same time, as much
as half of money was spent on salaries for teachers and workers in three years
given, while the least expense was for insurance fee in each year in the chart.
First
of all, spending on teachers’ salaries composed 40%, 50% and 45% in 1981, 1991
and 2001 respectively. Following this, the second largest proportion was spent
on other workers’ income at 28% and 22% in 1981 and 1991, whereas buying
furniture and equipment accounted for the second largest spending at 23% and only
15% was used for other workers’ salaries in 2001.
Looking
at the others, 15% of total expenditure was spent on resources in 1981, which observed
5% points of increase and threefold decrease in 1991 and 2001. Interestingly,
total cost on insurance experienced considerable growth with the figure of 8%
in 2001, compared to 2% and 3% in 1981 and 1991.
감사합니다 :)

 댓글 0개
댓글 0개


 불편사항 신고